EGS Collab Experiment 1: Temperature profile

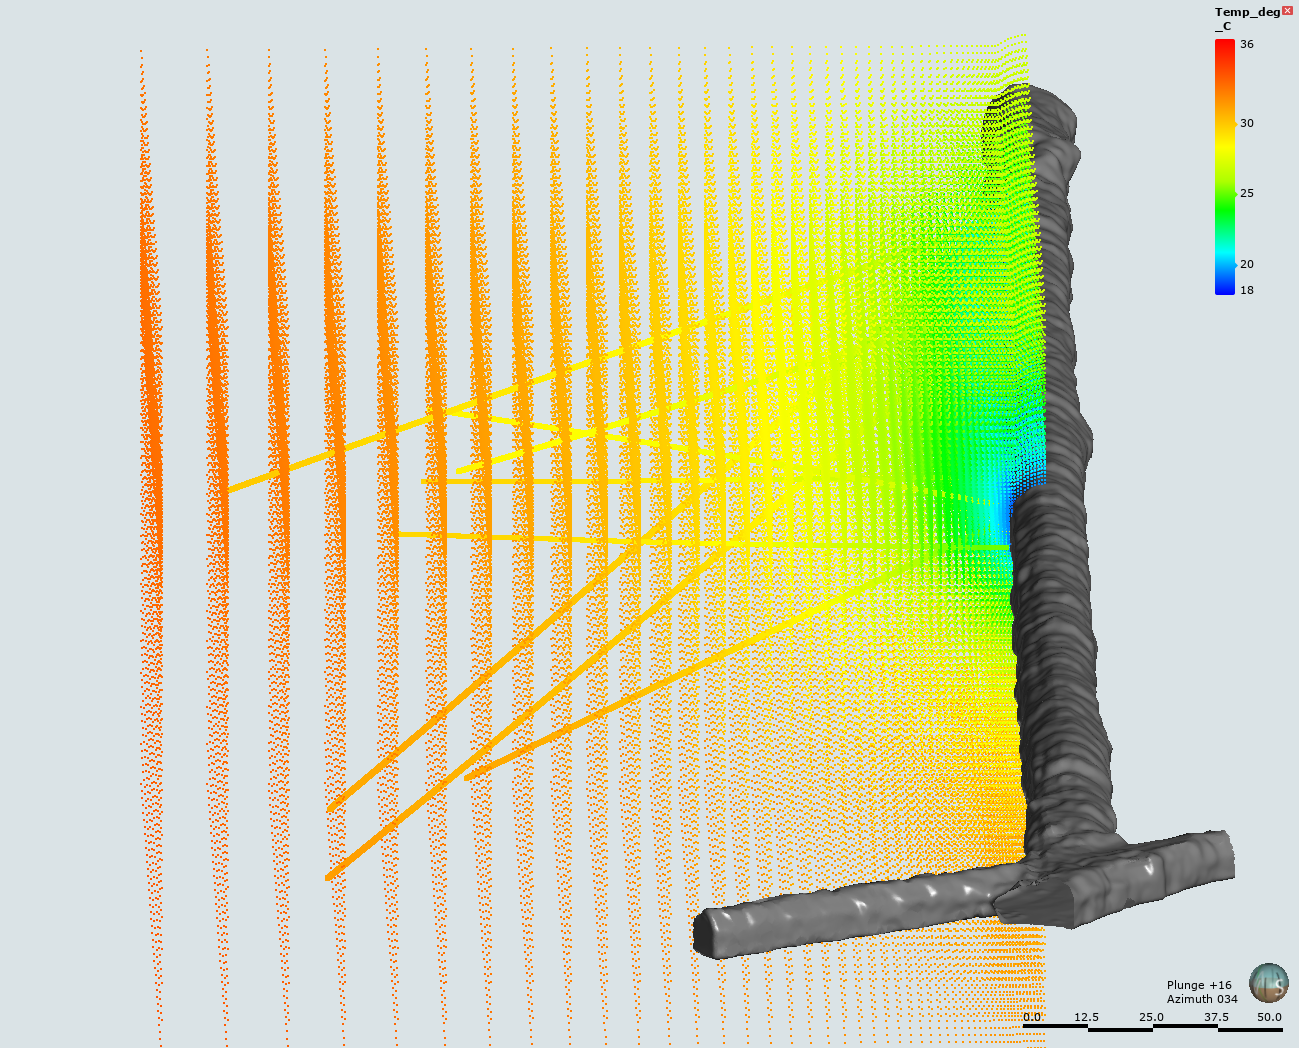
This submission includes an input file, plot file, Fortran conversion file, and 3D data file from the simulation of the temperature profile within the Test Bed #1 of the EGS Collab project. The simulation was executed with PNNL's STOMP-GT simulator, which reads the input file, and produces the STOMP-GT Simulated 2D Temperature Distribution Data (plot.001302 file). The Fortran conversion file, converts the STOMP-GT Simulated 2D Temperature Distribution Data (plot.001302) 2D results in local coordinates to 3D results in Homestake coordinates.
Citation Formats
TY  - DATA
AB  - This submission includes an input file, plot file, Fortran conversion file, and 3D data file from the simulation of the temperature profile within the Test Bed #1 of the EGS Collab project. The simulation was executed with PNNL's STOMP-GT simulator, which reads the input file, and produces the STOMP-GT Simulated 2D Temperature Distribution Data (plot.001302 file). The Fortran conversion file, converts the STOMP-GT Simulated 2D Temperature Distribution Data (plot.001302) 2D results in local coordinates to 3D results in Homestake coordinates.
AU  - White, Mark
DB  - Geothermal Data Repository
DP  - Open EI | National Laboratory of the Rockies
DO  - 10.15121/1512083
KW  - geothermal
KW  - energy
KW  - SURF
KW  - EGS Collab
KW  - numerical simulation
KW  - STOMP-GT
KW  - data
KW  - EGS
KW  - temperature
KW  - distribution
KW  - 3D
KW  - West Access Drift
KW  - Fortran
KW  - code
KW  - Sanford Underground Research Facility
LA  - English
DA  - 2019/04/01
PY  - 2019
PB  - Pacific Northwest National Laboratory
T1  - EGS Collab Experiment 1: Temperature profile
UR  - https://doi.org/10.15121/1512083
ER  -
White, Mark. EGS Collab Experiment 1: Temperature profile. Pacific Northwest National Laboratory, 1 April, 2019, Geothermal Data Repository. https://doi.org/10.15121/1512083.
White, M. (2019). EGS Collab Experiment 1: Temperature profile. [Data set]. Geothermal Data Repository. Pacific Northwest National Laboratory. https://doi.org/10.15121/1512083
White, Mark. EGS Collab Experiment 1: Temperature profile. Pacific Northwest National Laboratory, April, 1, 2019. Distributed by Geothermal Data Repository. https://doi.org/10.15121/1512083
@misc{GDR_Dataset_1127,
title = {EGS Collab Experiment 1: Temperature profile},
author = {White, Mark},
abstractNote = {This submission includes an input file, plot file, Fortran conversion file, and 3D data file from the simulation of the temperature profile within the Test Bed #1 of the EGS Collab project. The simulation was executed with PNNL's STOMP-GT simulator, which reads the input file, and produces the STOMP-GT Simulated 2D Temperature Distribution Data (plot.001302 file). The Fortran conversion file, converts the STOMP-GT Simulated 2D Temperature Distribution Data (plot.001302) 2D results in local coordinates to 3D results in Homestake coordinates.},
url = {https://gdr.openei.org/submissions/1127},
year = {2019},
howpublished = {Geothermal Data Repository, Pacific Northwest National Laboratory, https://doi.org/10.15121/1512083},
note = {Accessed: 2026-07-25},
doi = {10.15121/1512083}
}
https://dx.doi.org/10.15121/1512083
Details
Data from Apr 1, 2019
Last updated Oct 19, 2023
Submitted Apr 1, 2019
Organization
Pacific Northwest National Laboratory
Contact
Mark White
509.372.6070
Authors
Keywords
geothermal, energy, SURF, EGS Collab, numerical simulation, STOMP-GT, data, EGS, temperature, distribution, 3D, West Access Drift, Fortran, code, Sanford Underground Research FacilityDOE Project Details
Project Name EGS Collab
Project Lead Lauren Boyd
Project Number EE0032708