Risk Factor Analysis in Low-Temperature Geothermal Play Fairway Analysis for the Appalachian Basin (GPFA-AB)

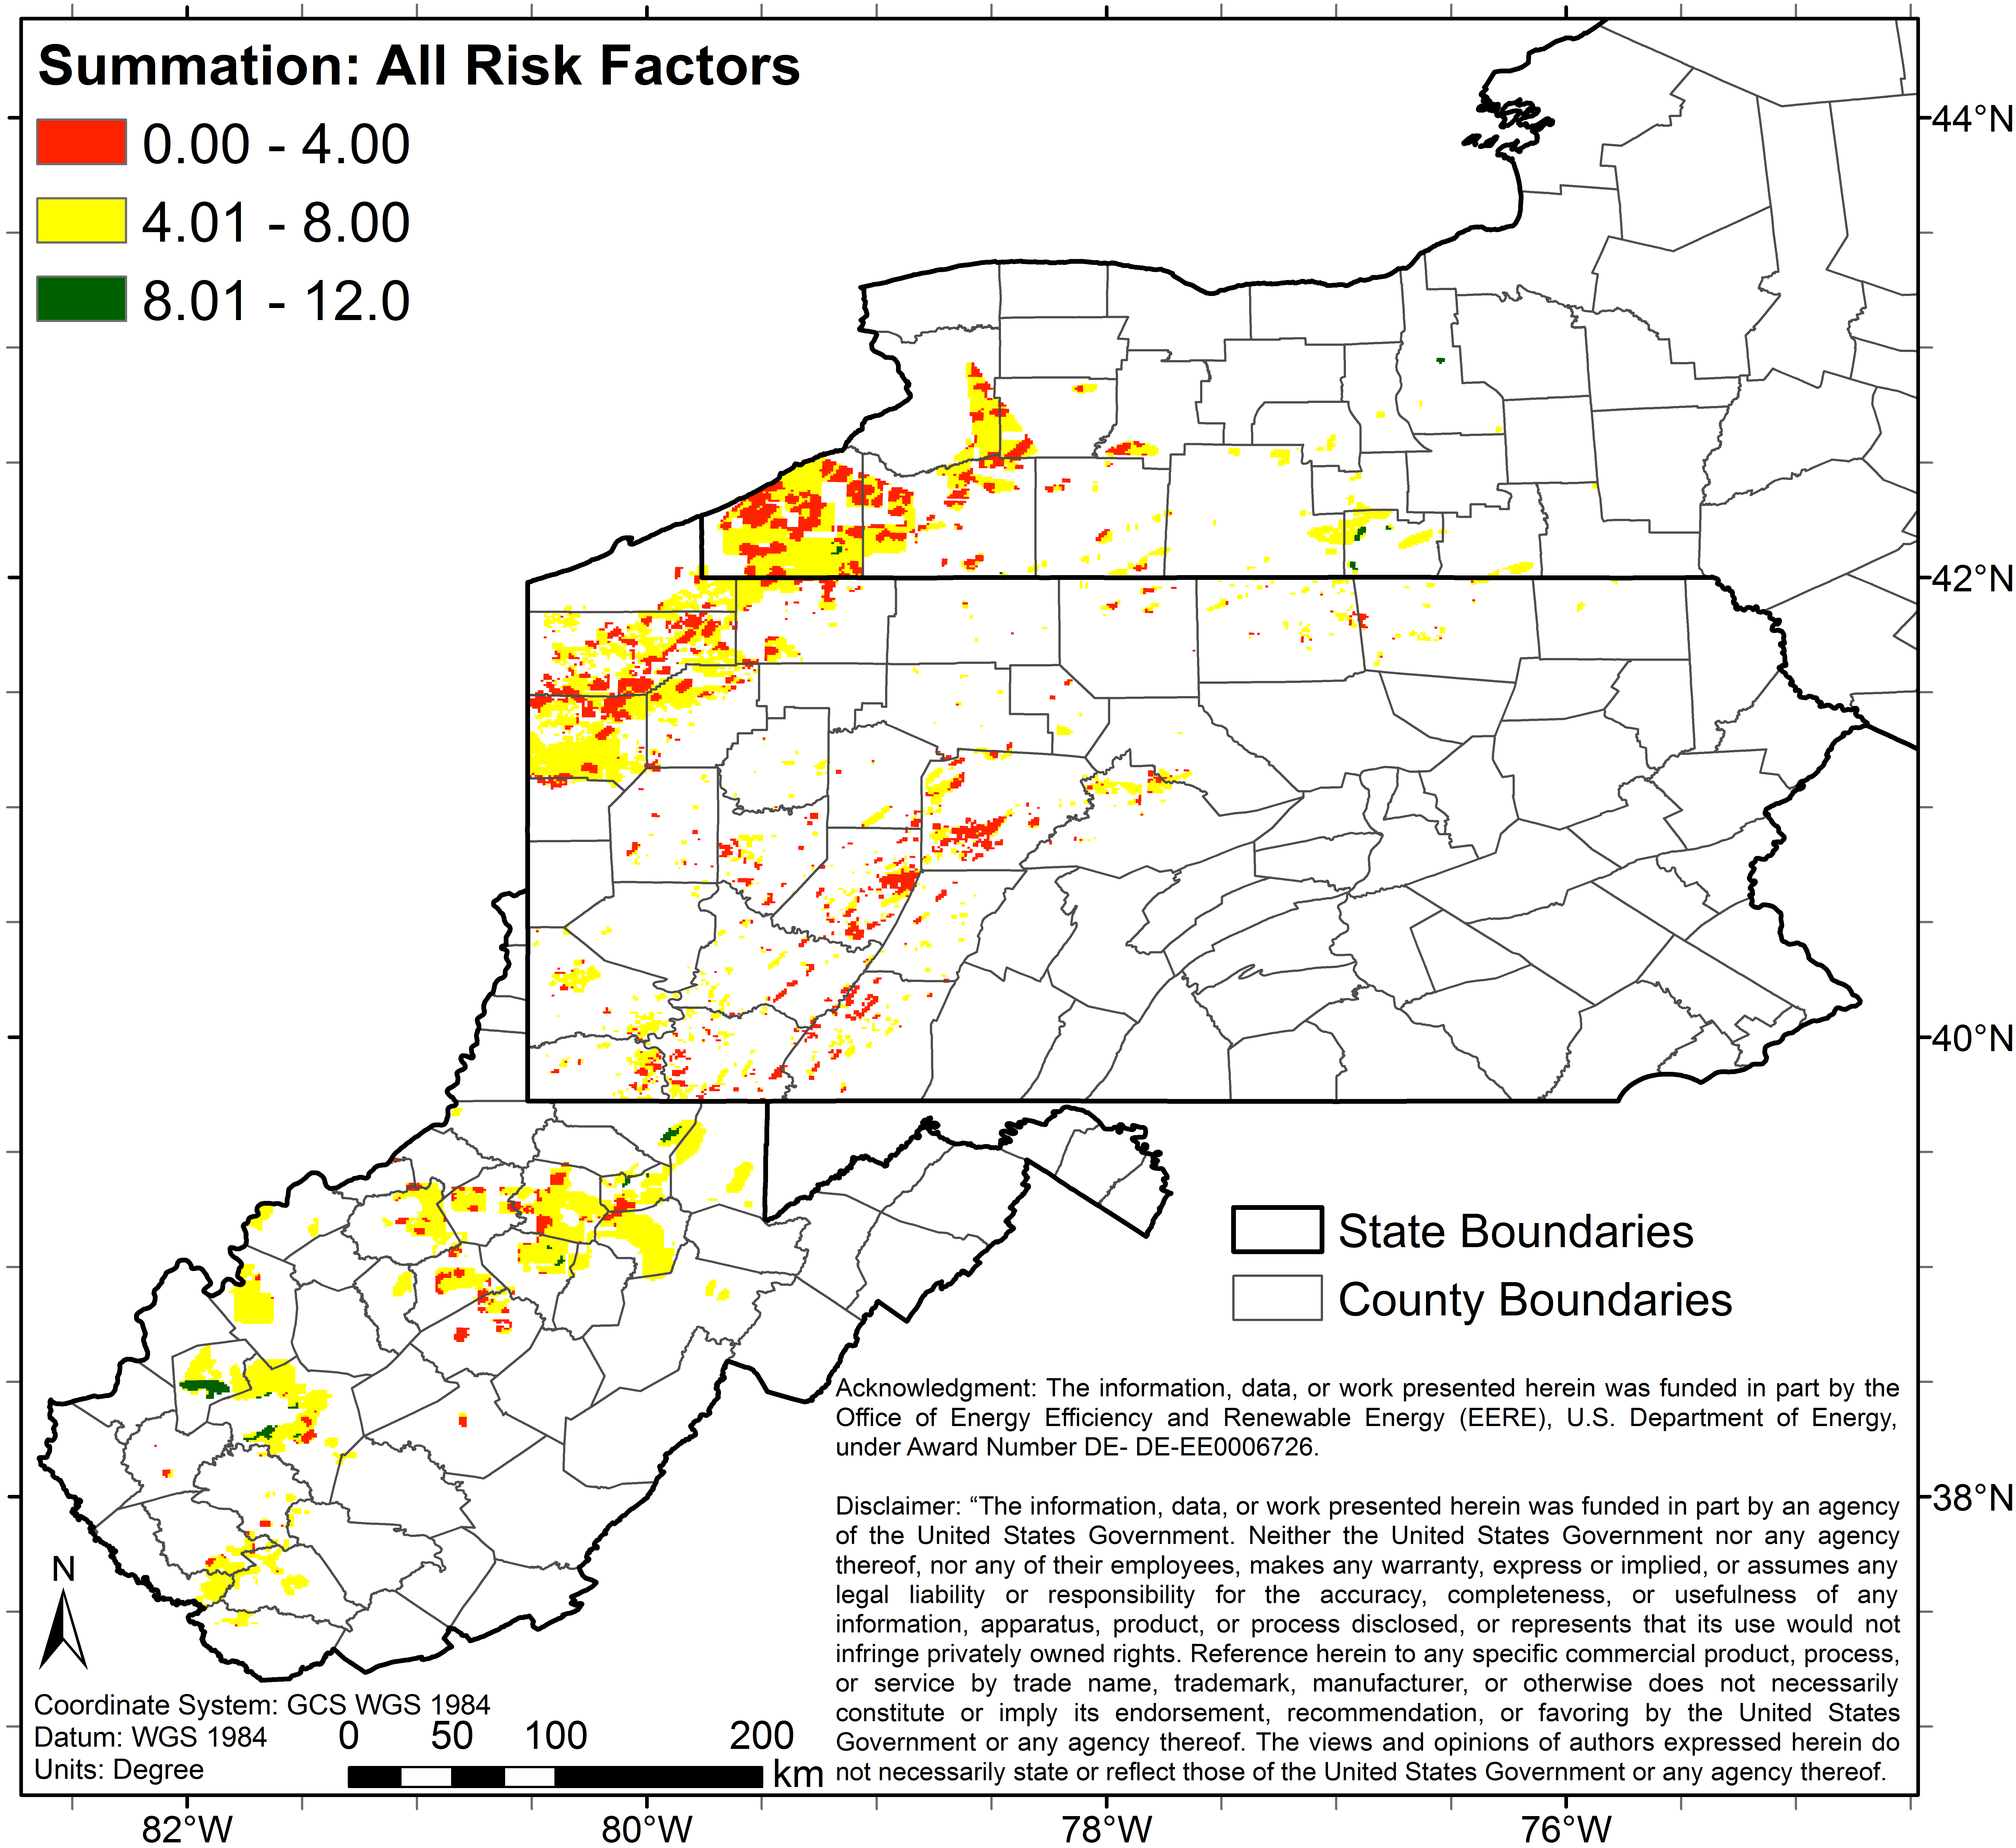
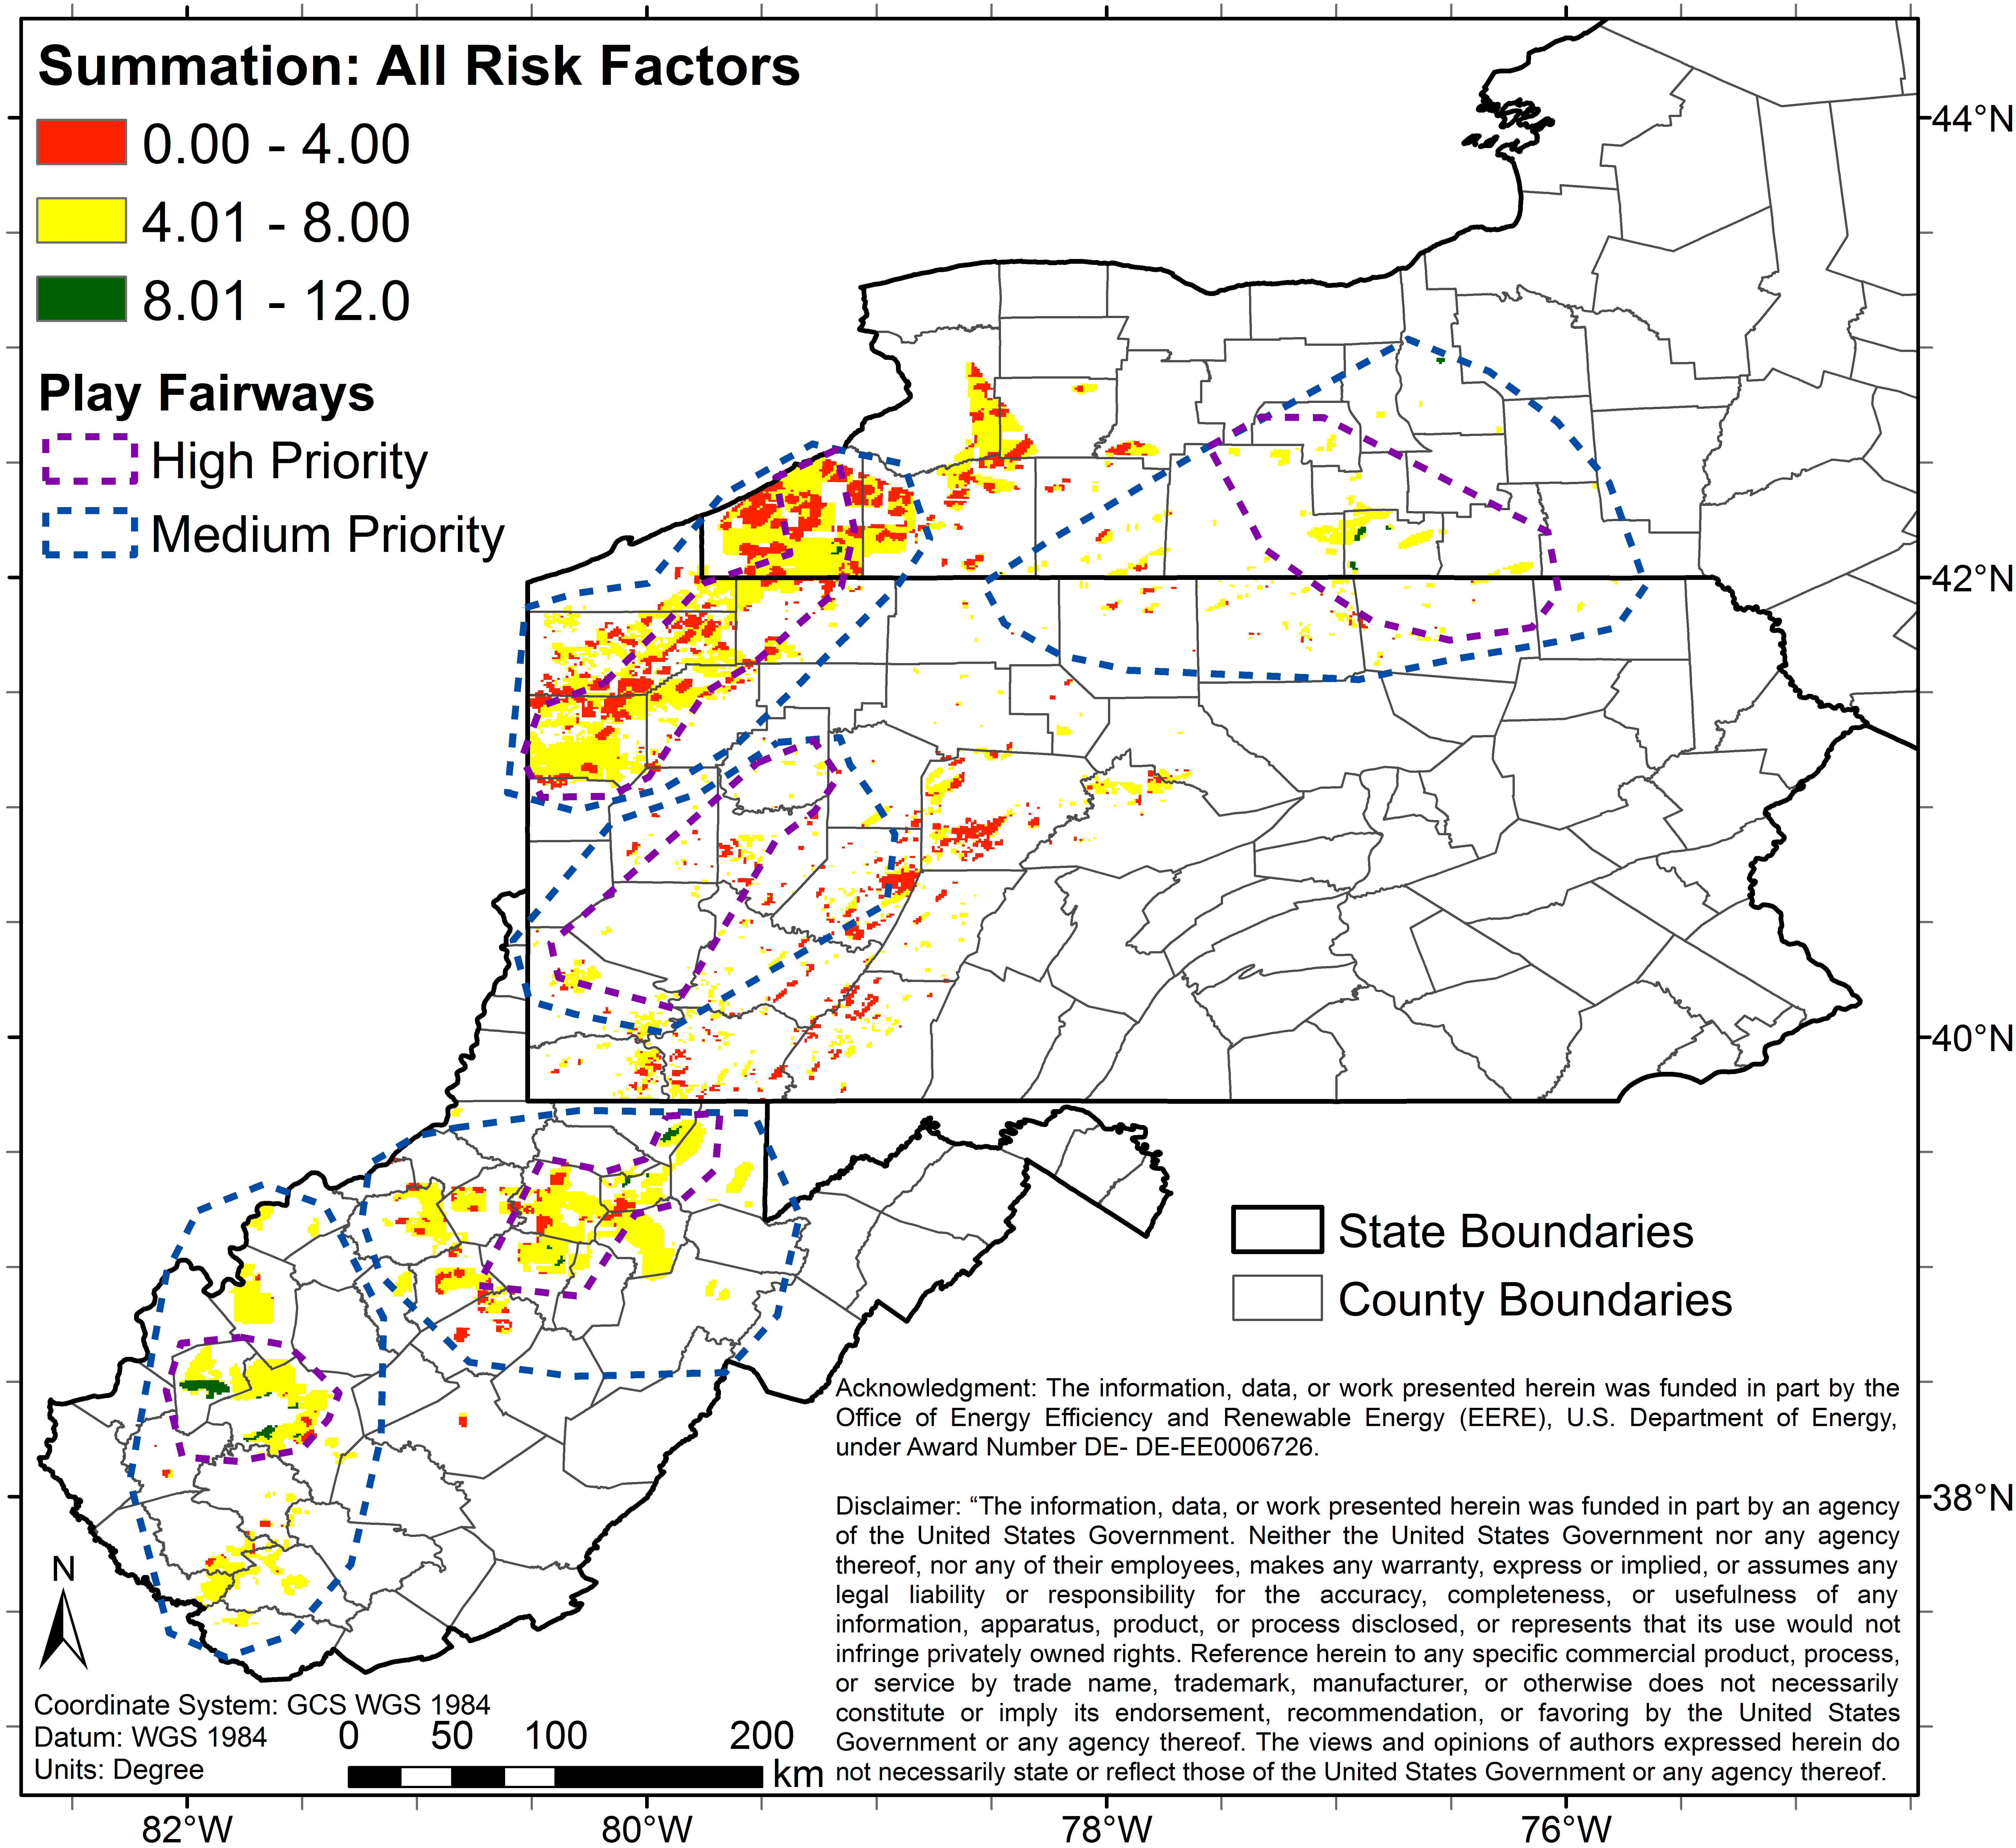
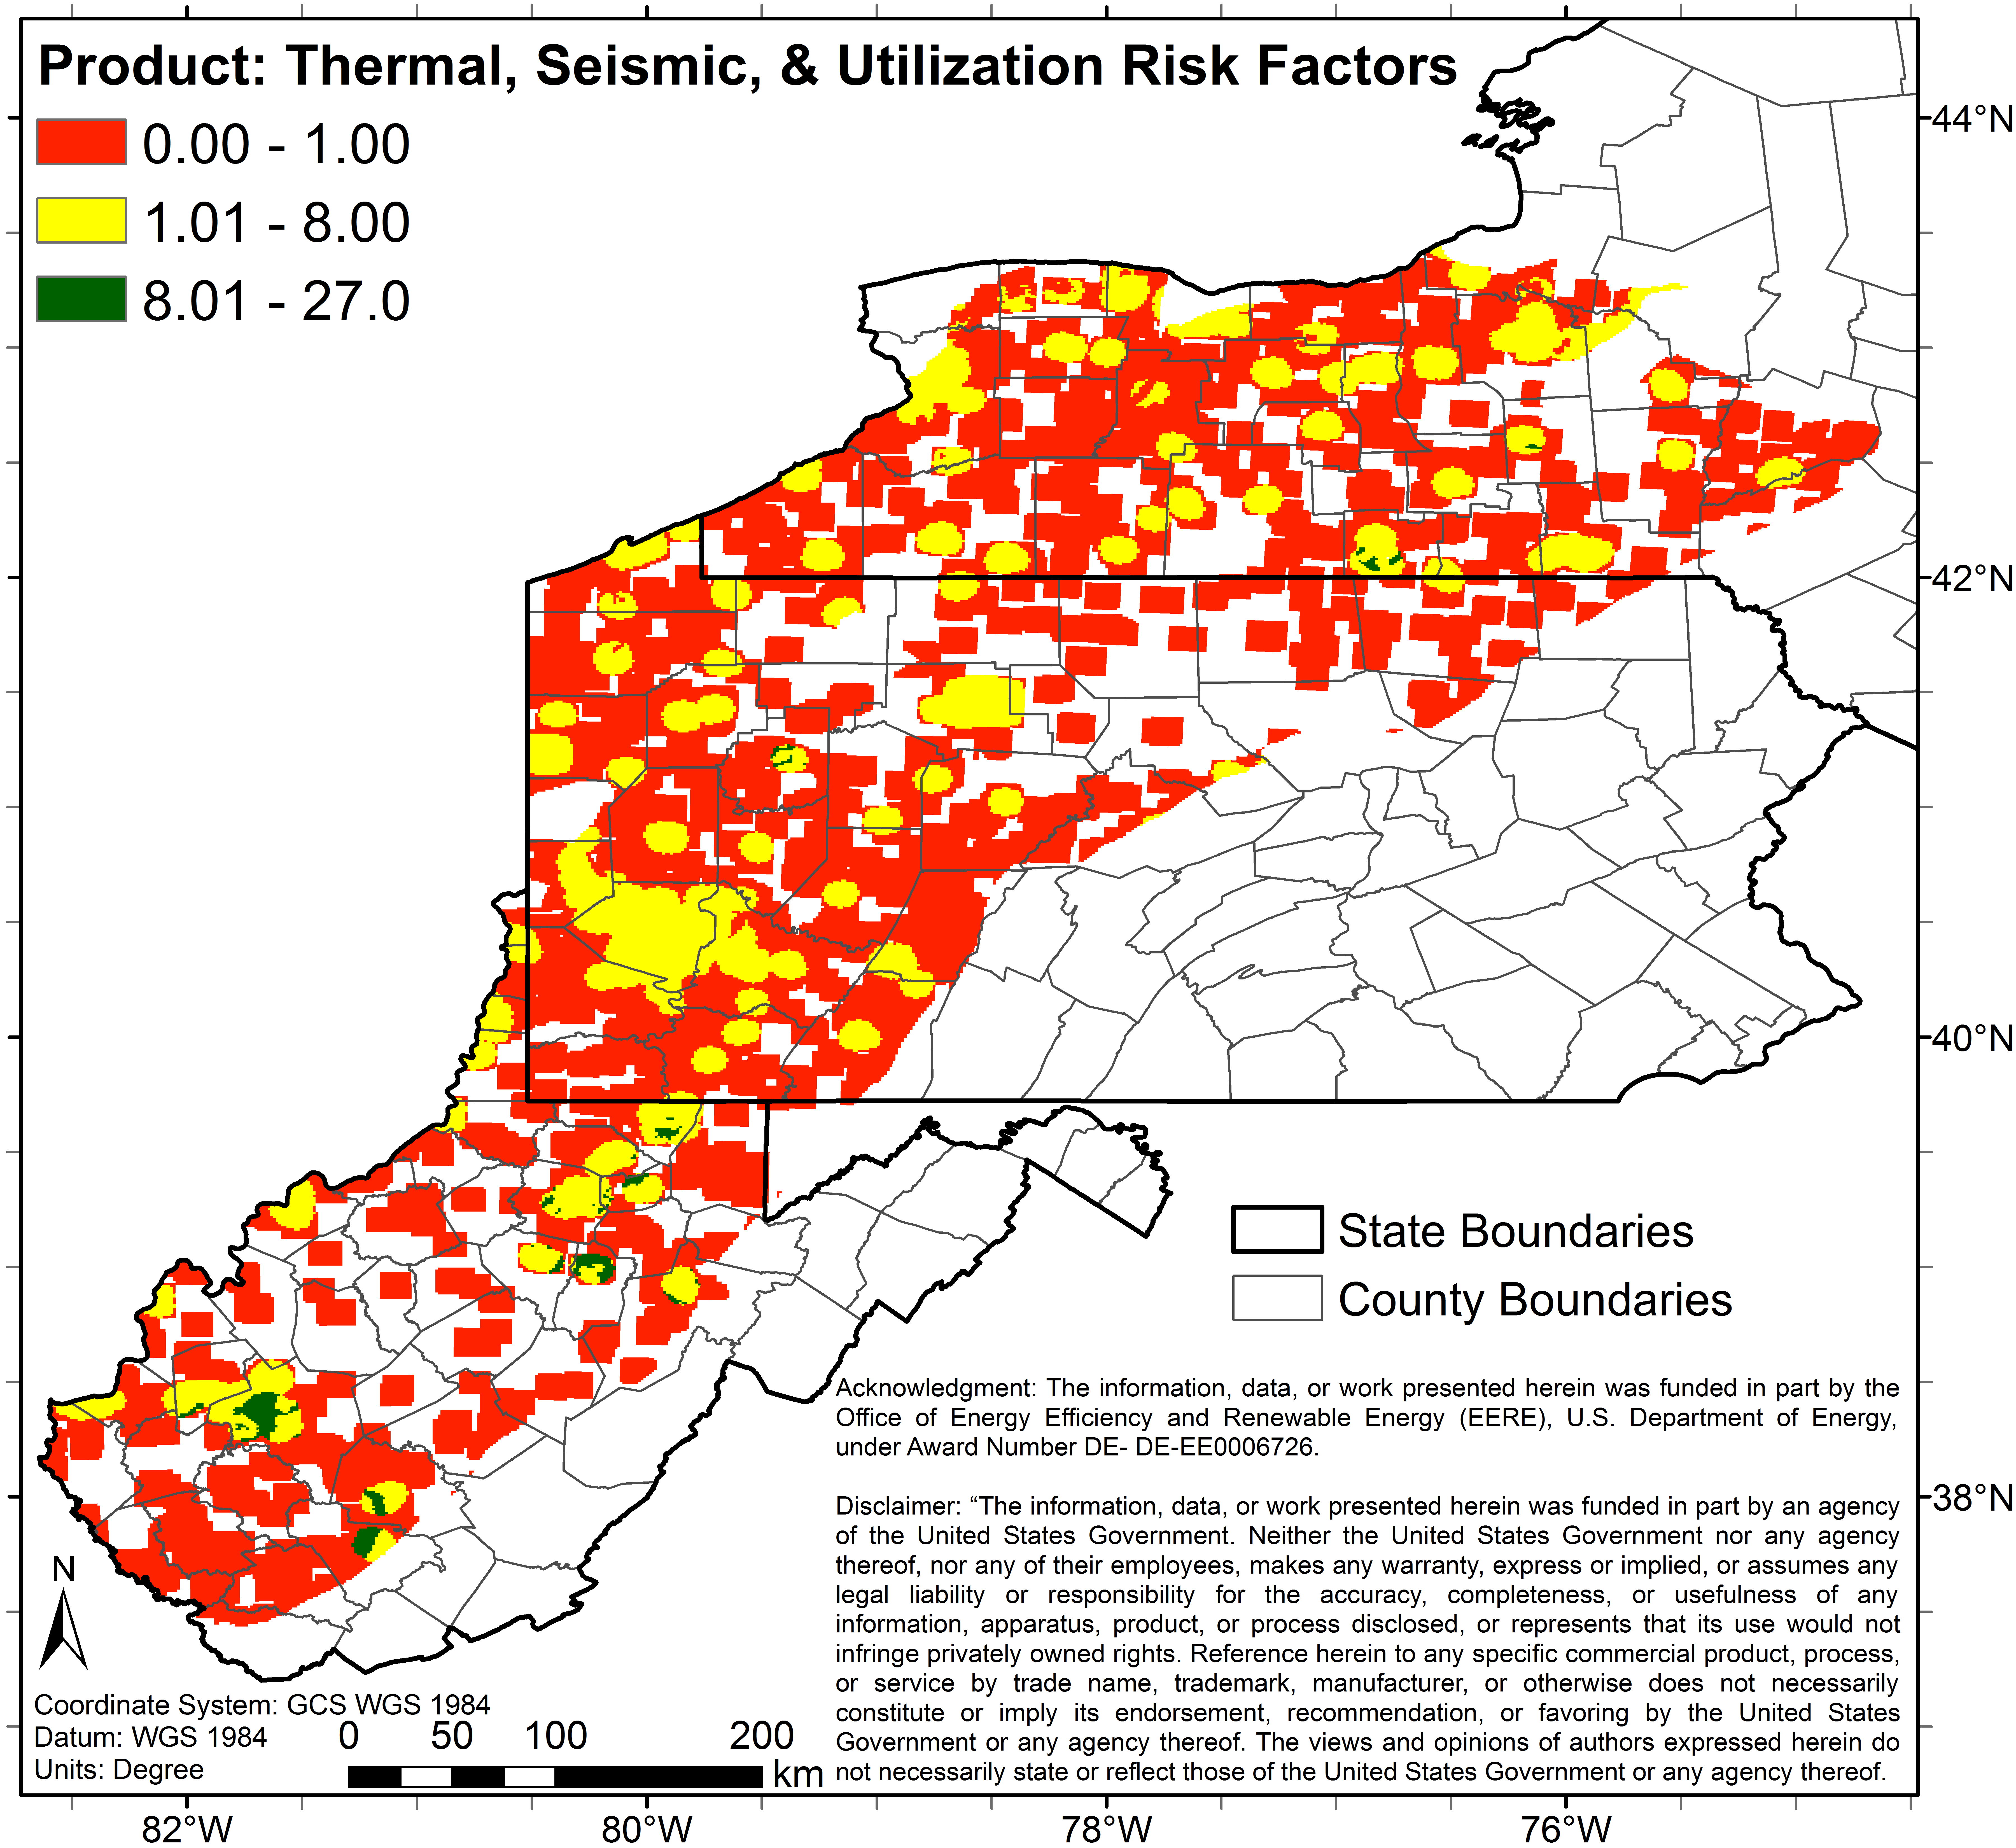
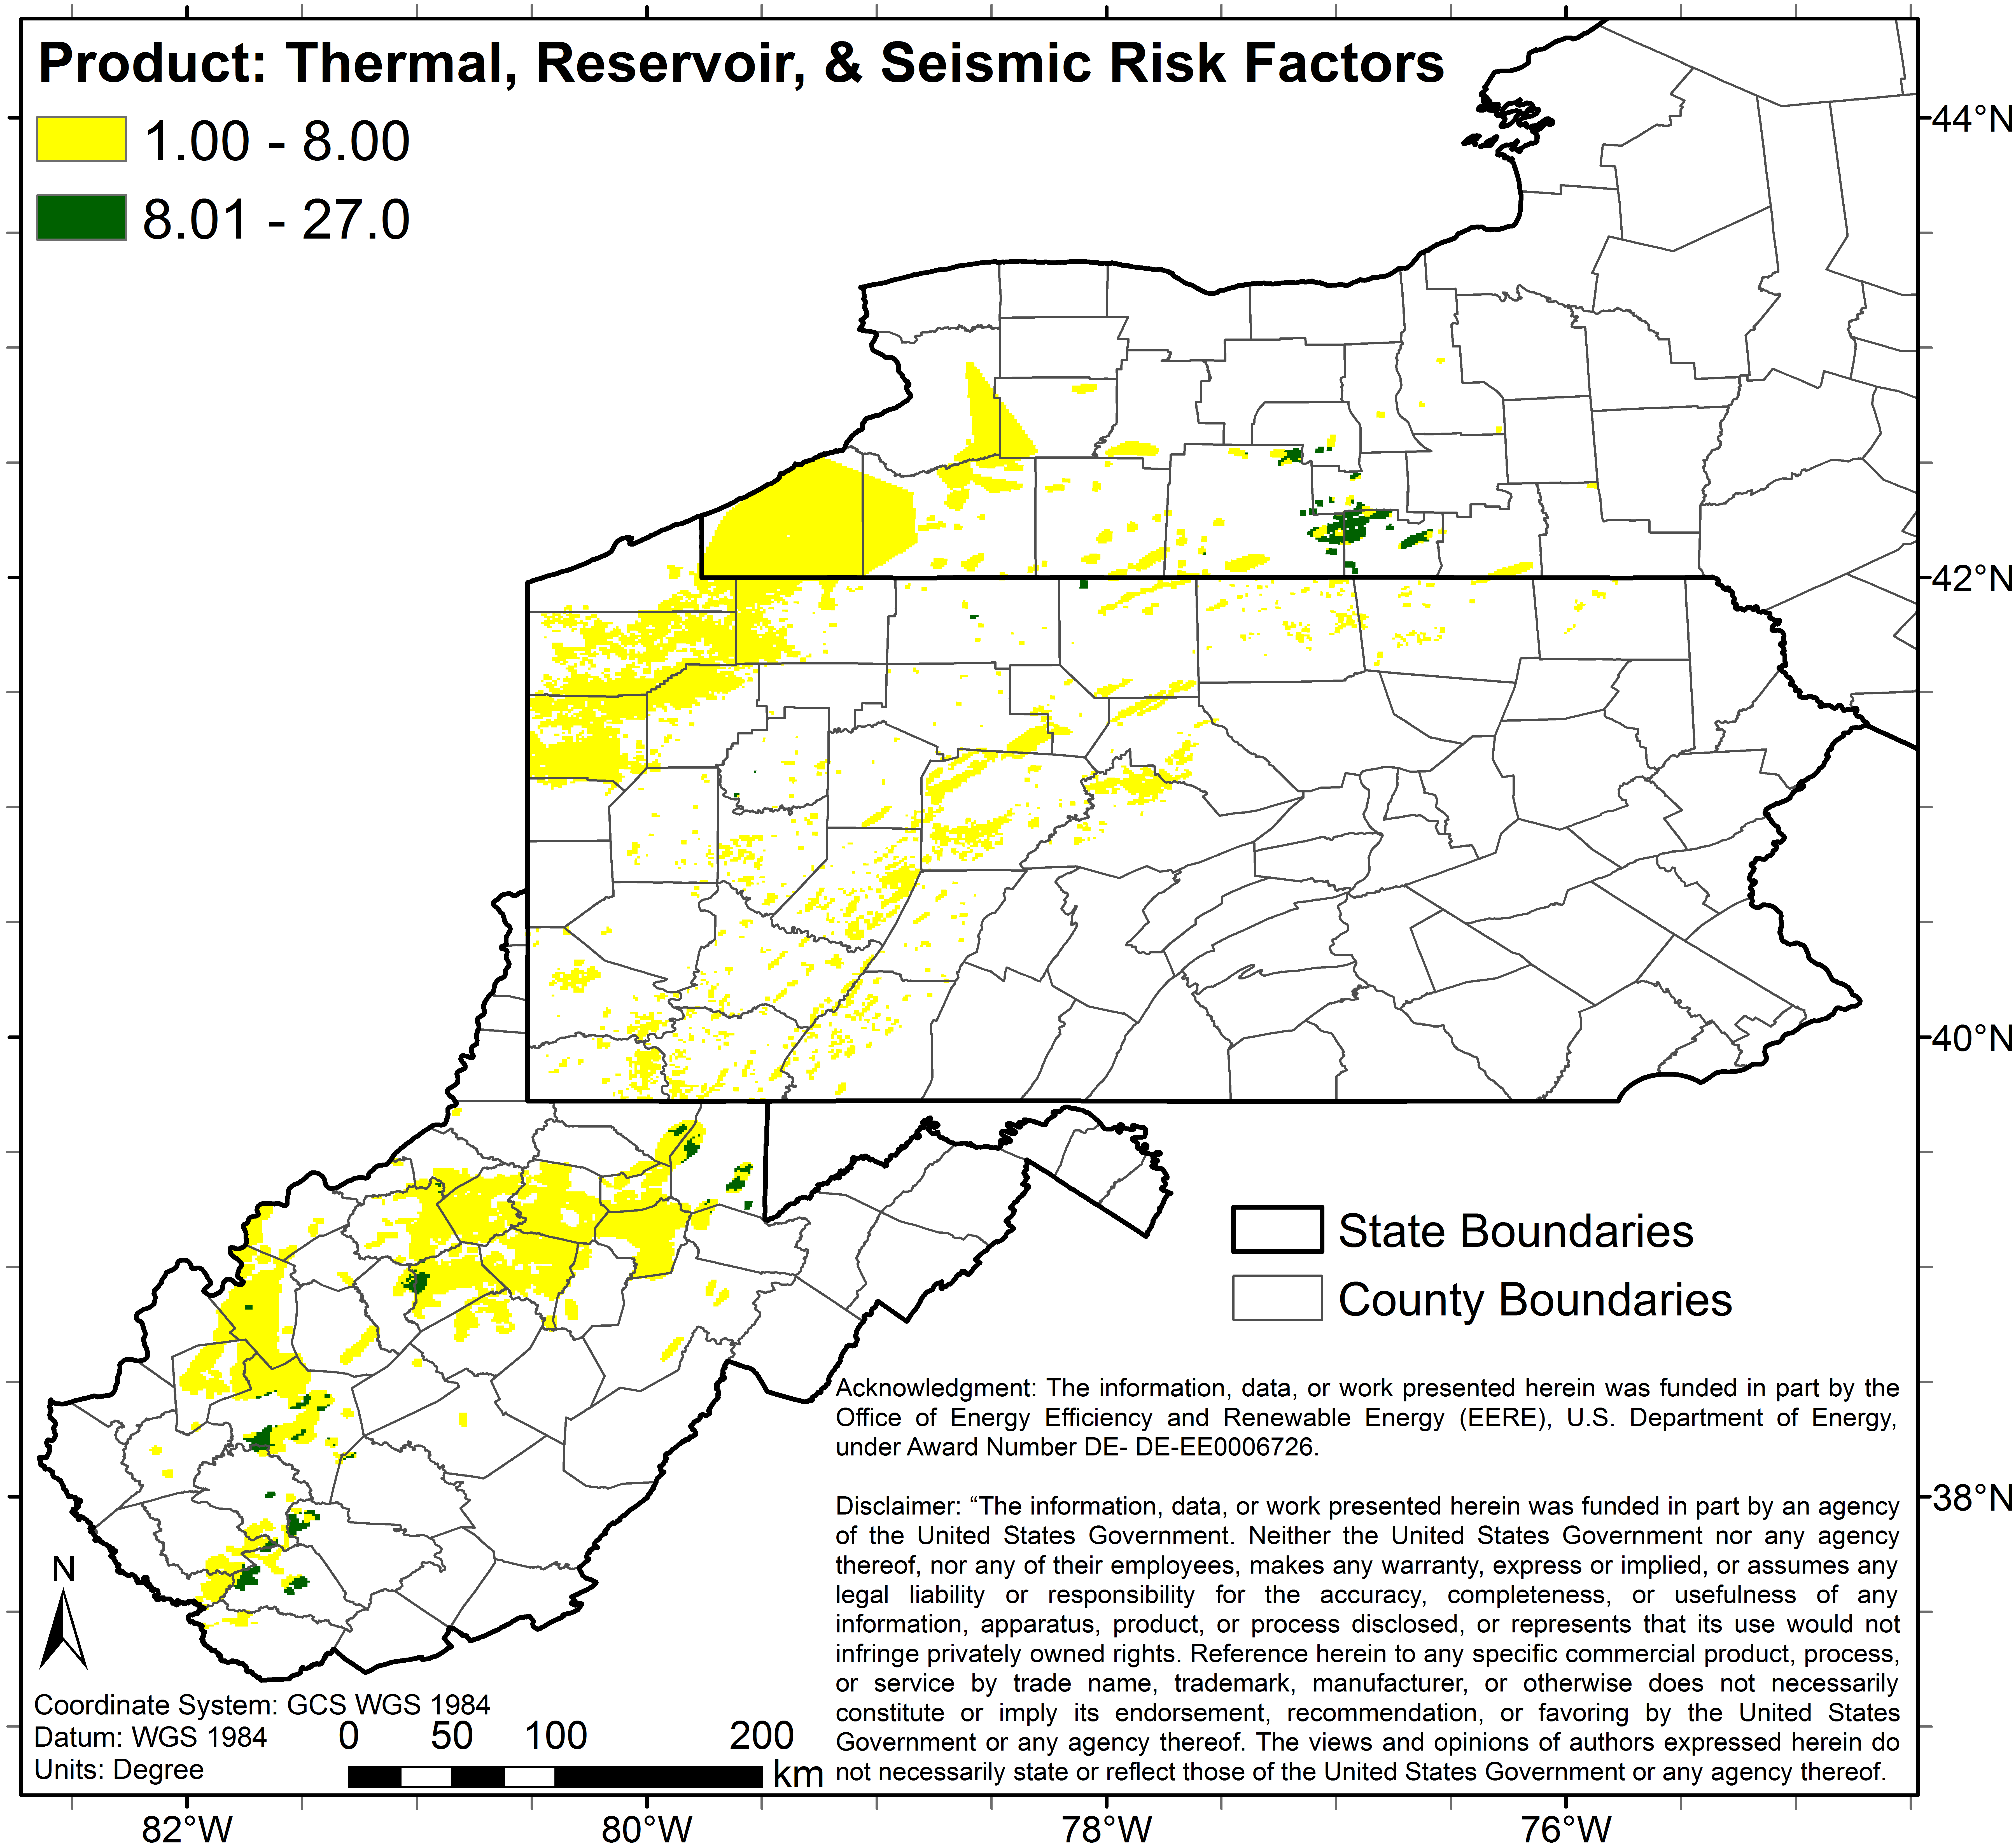
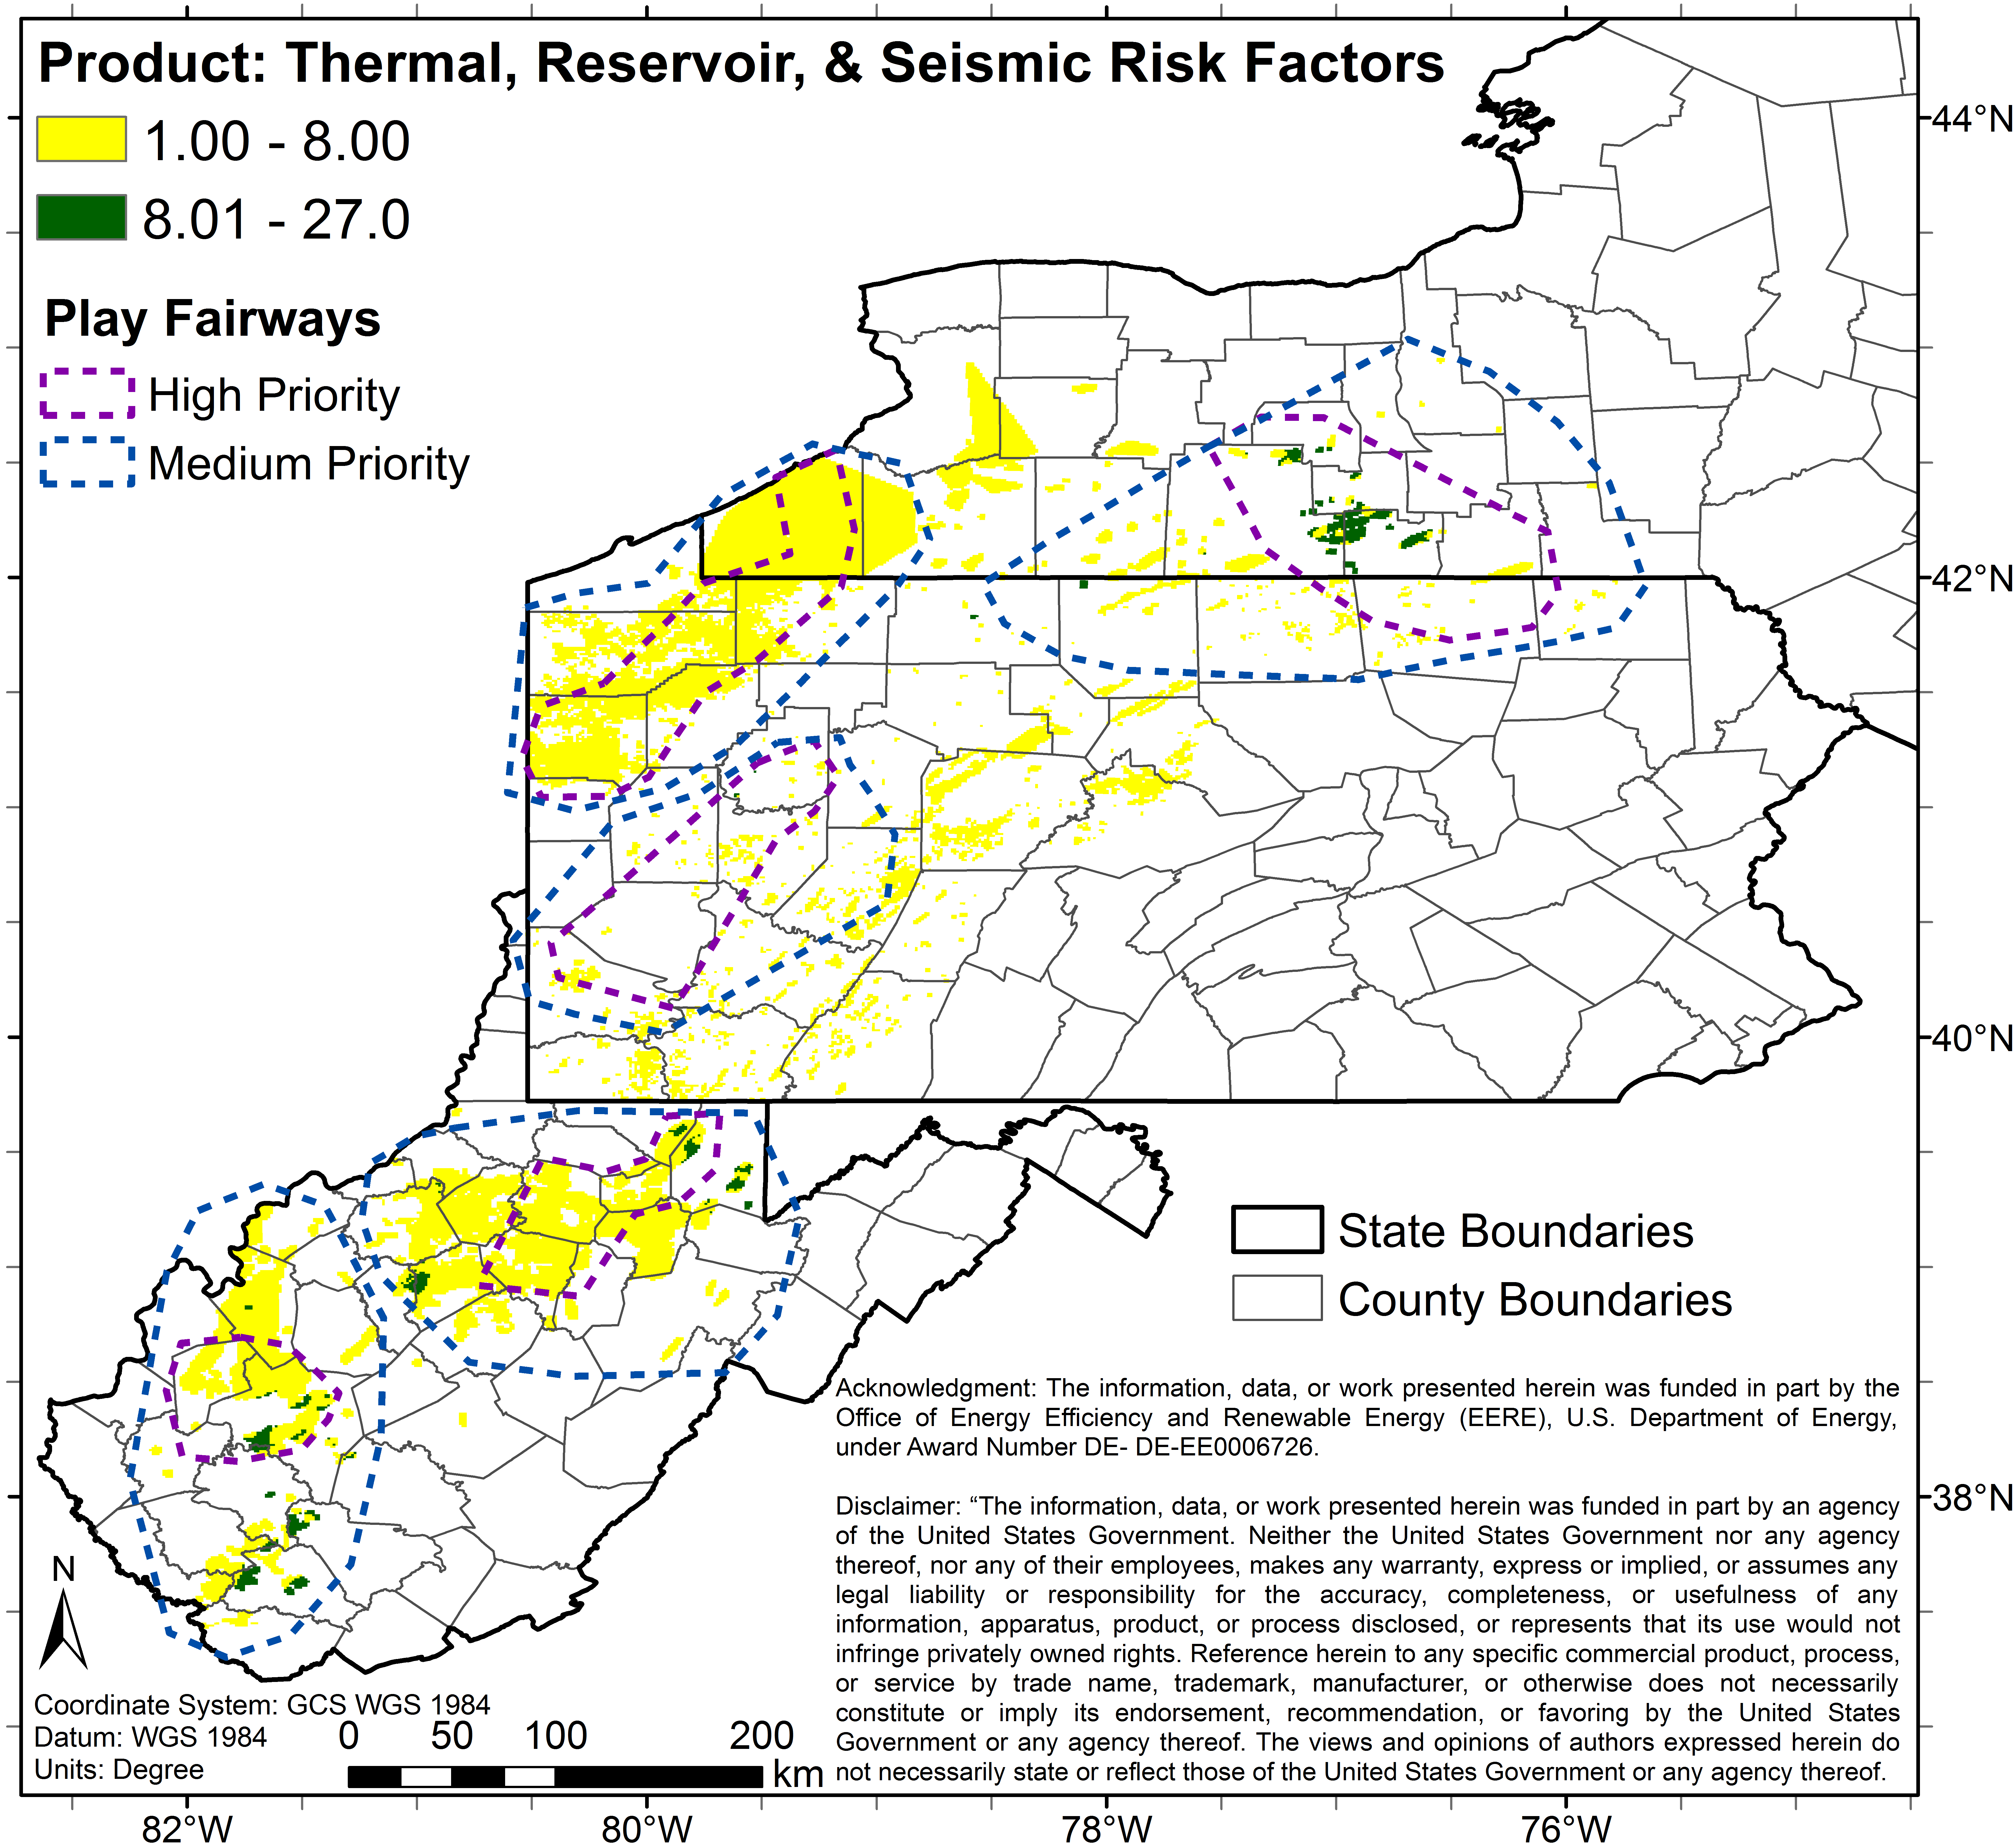
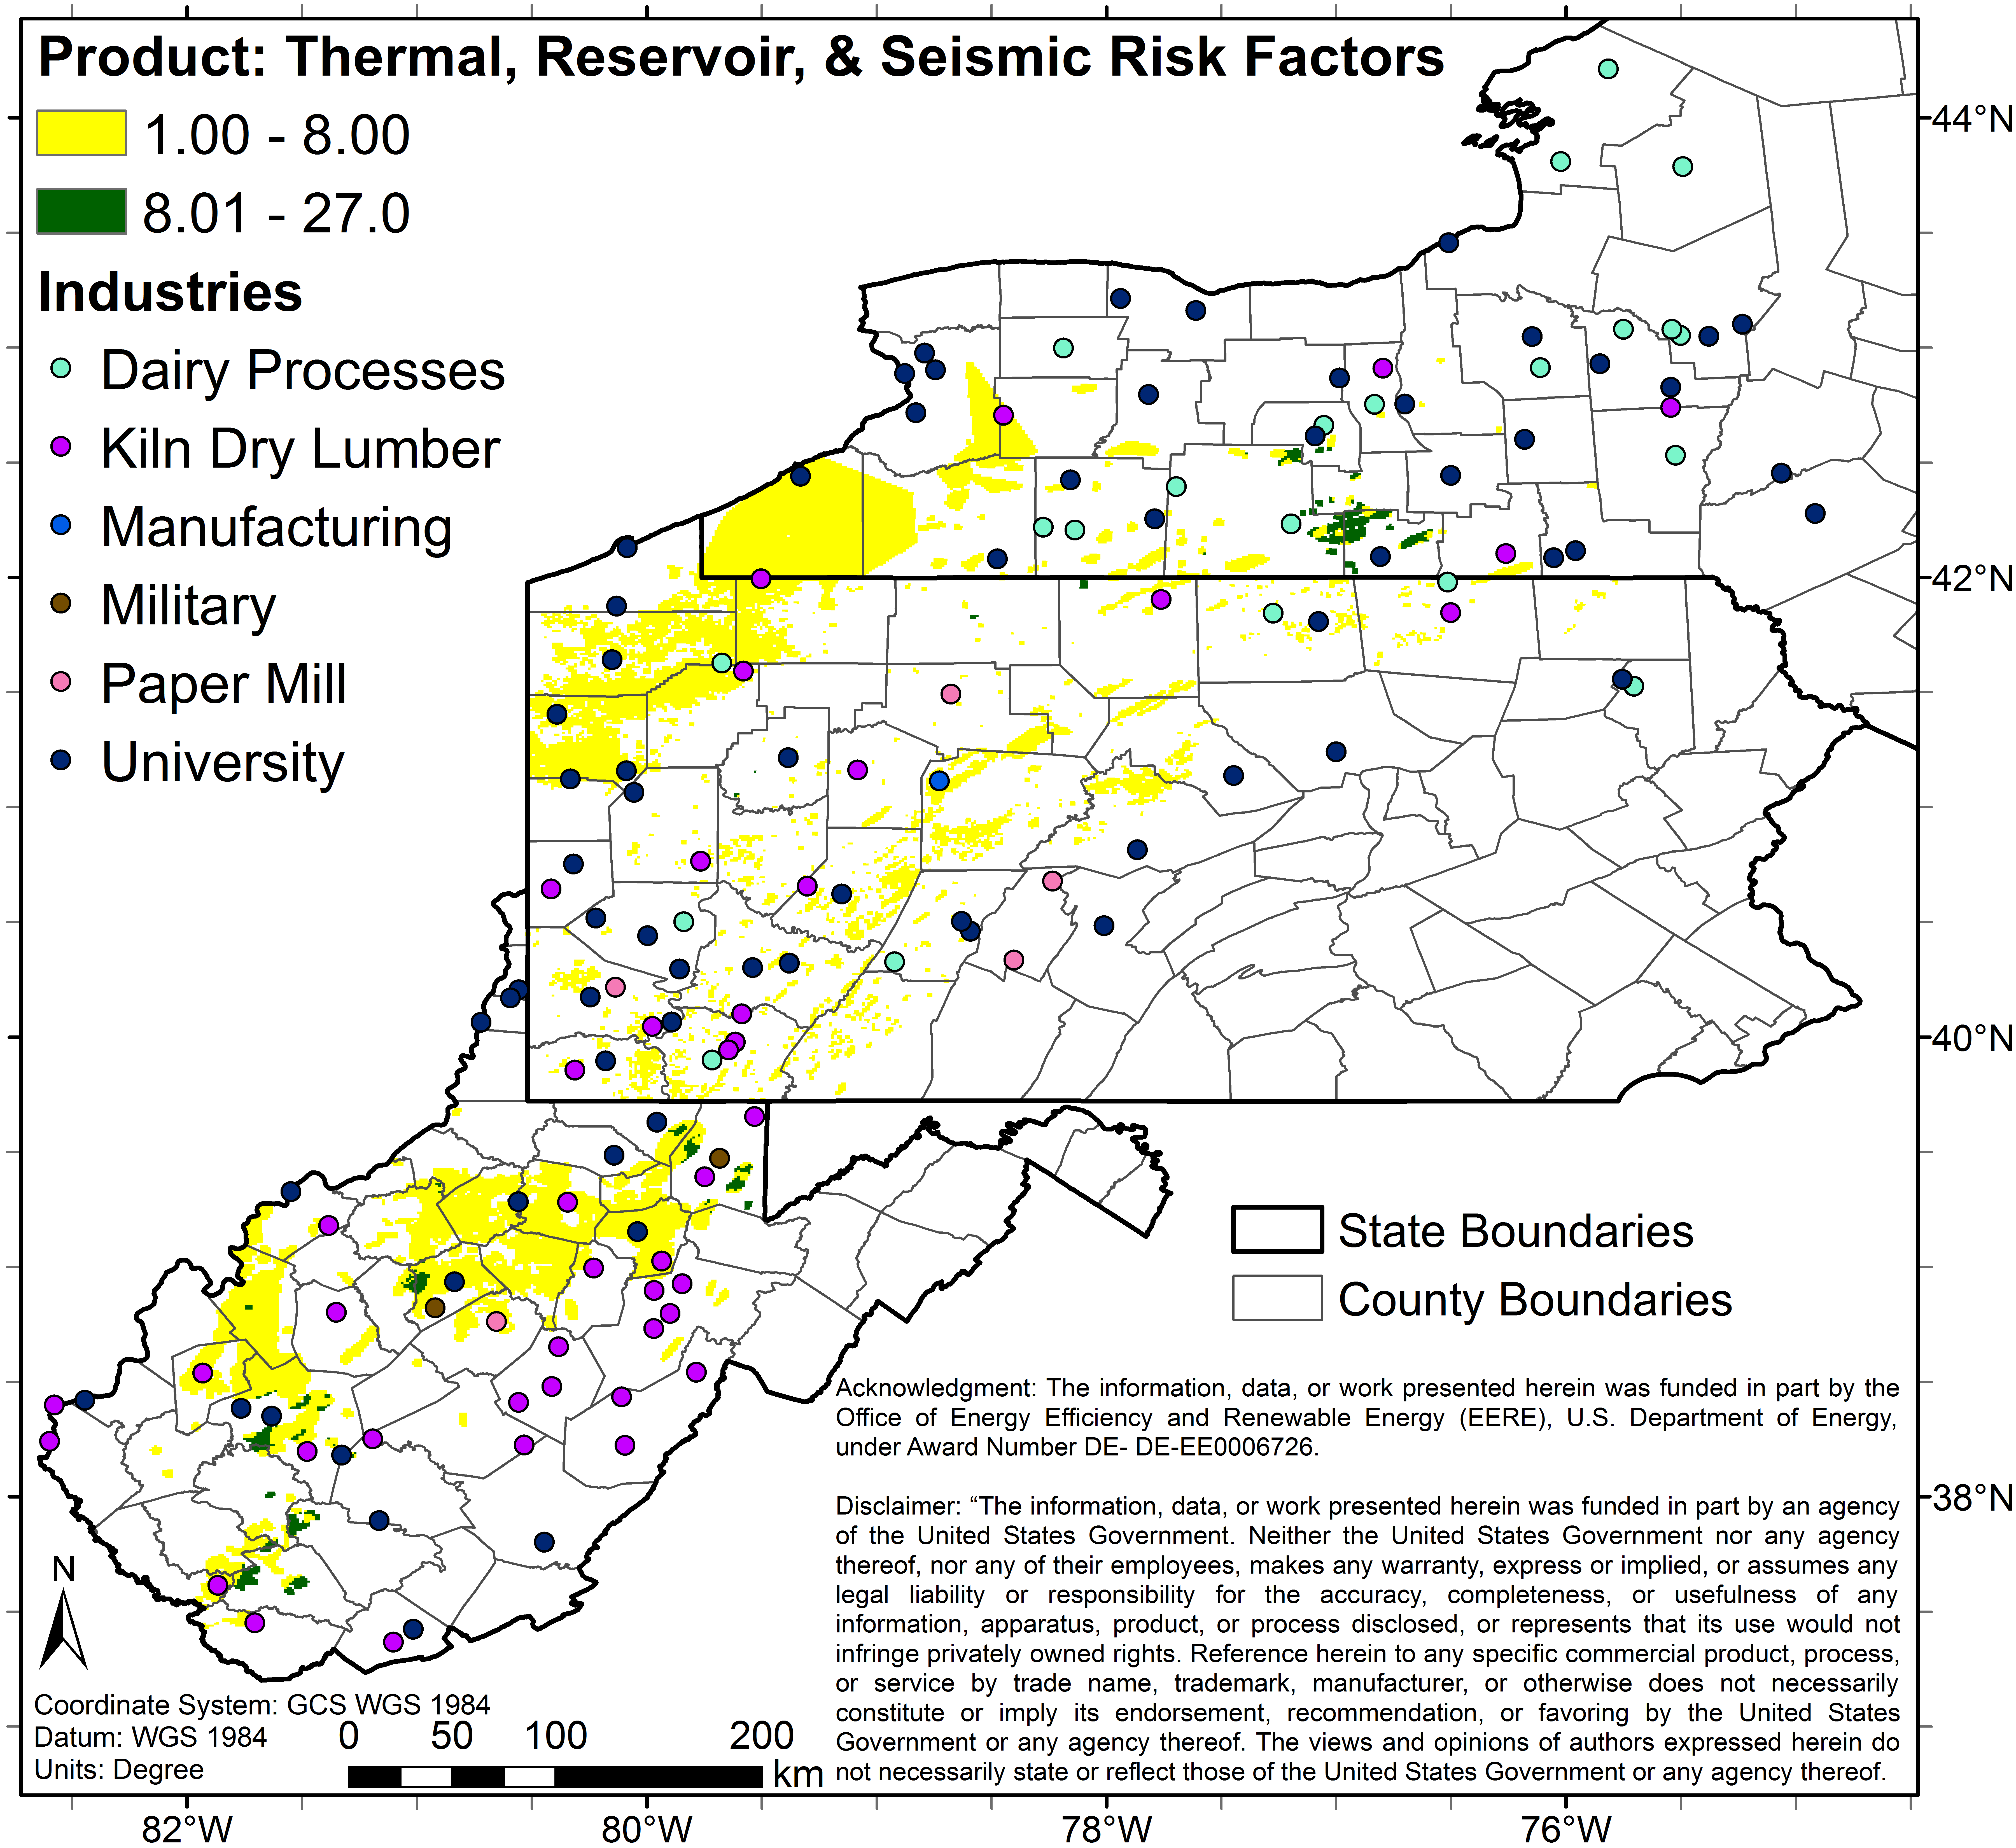
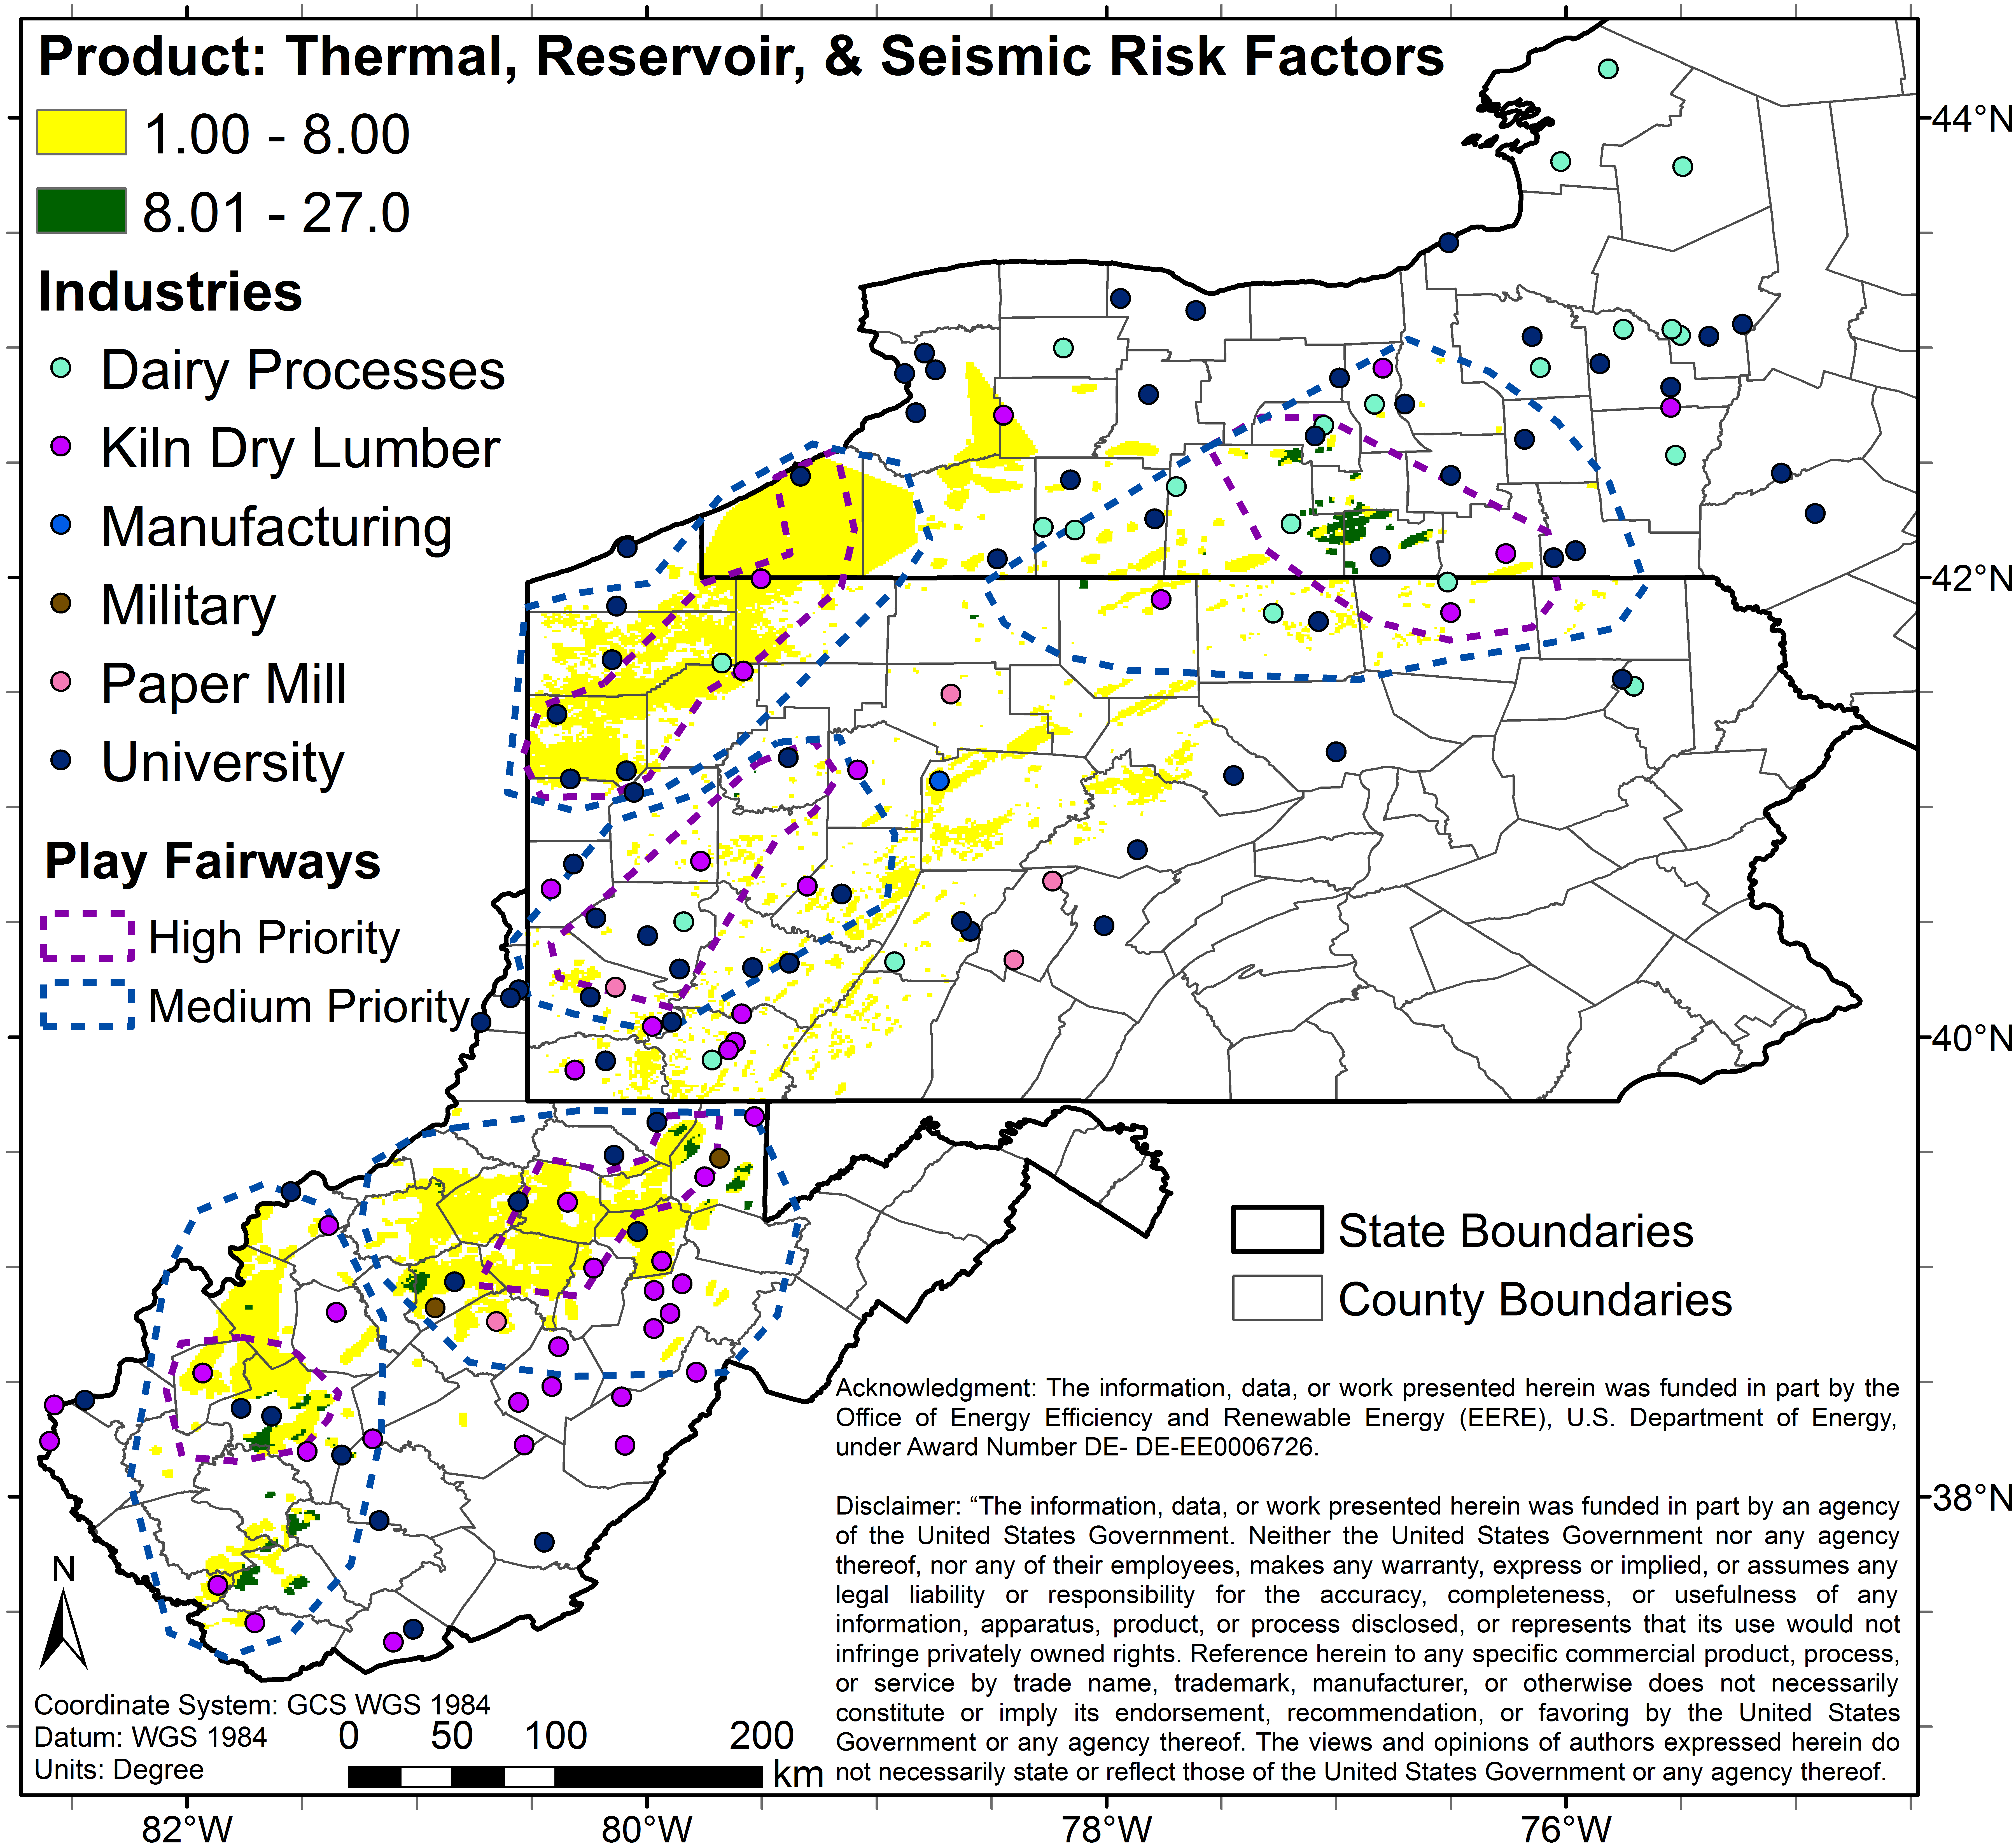
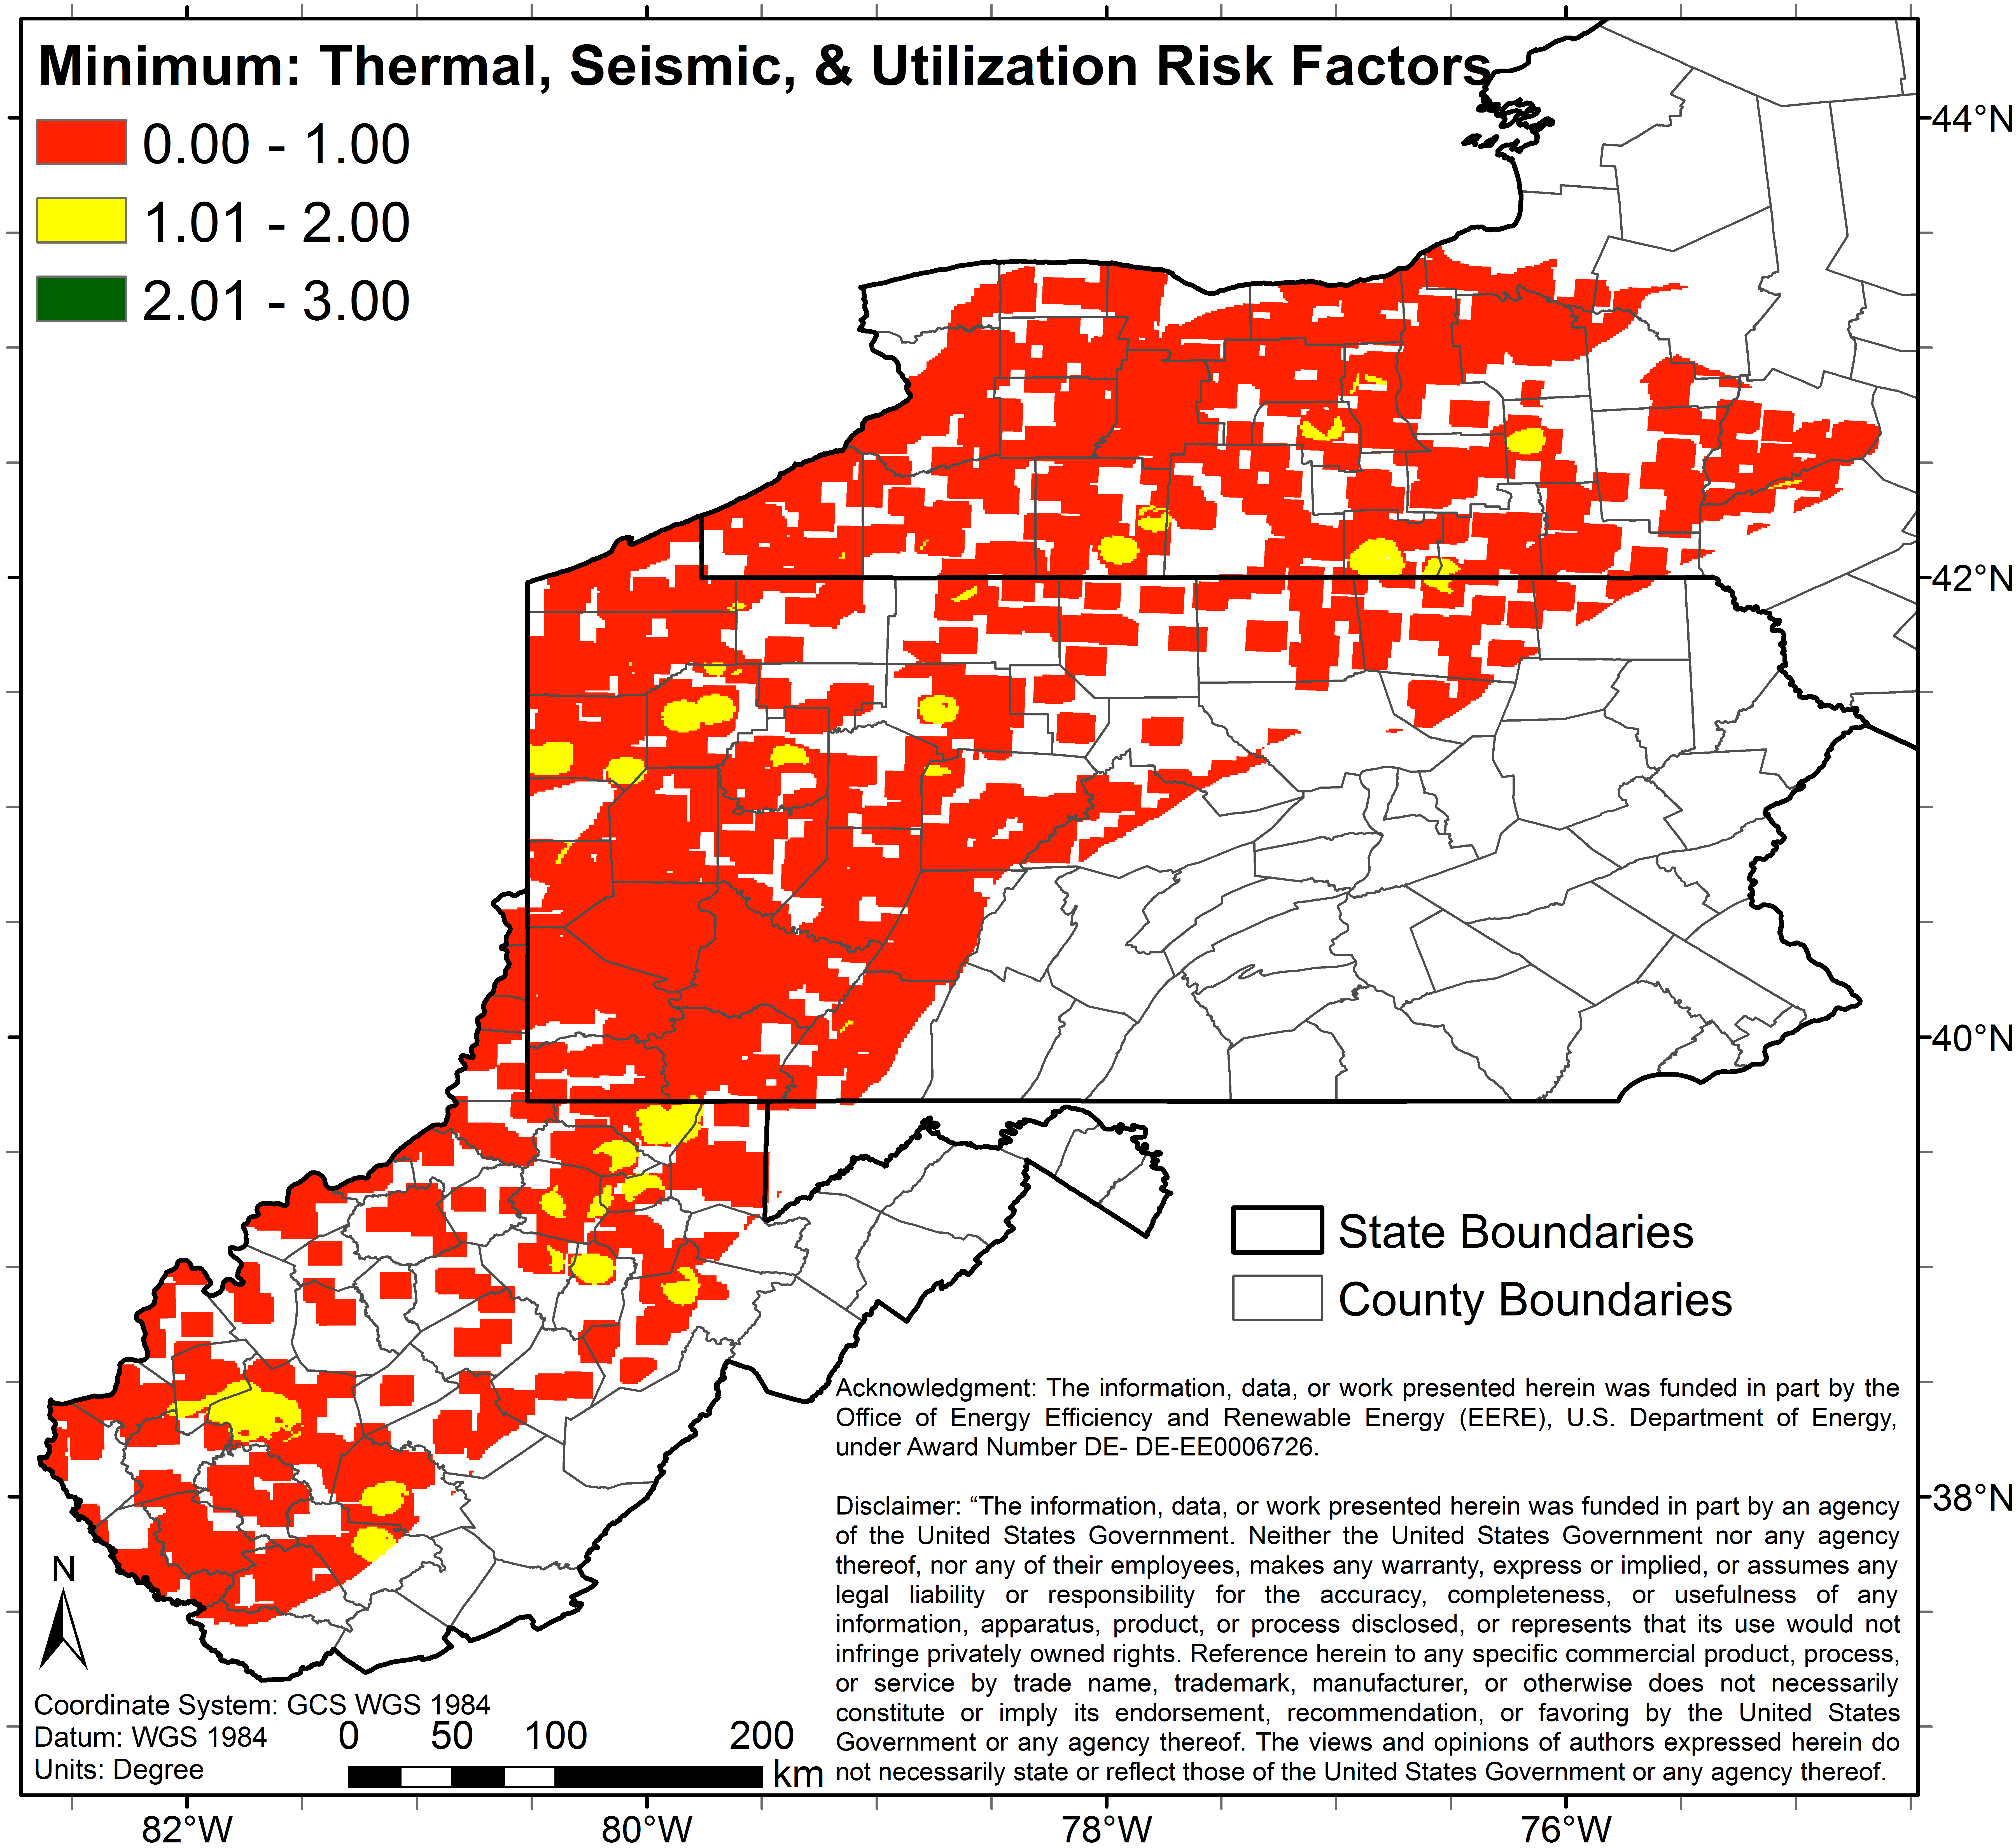
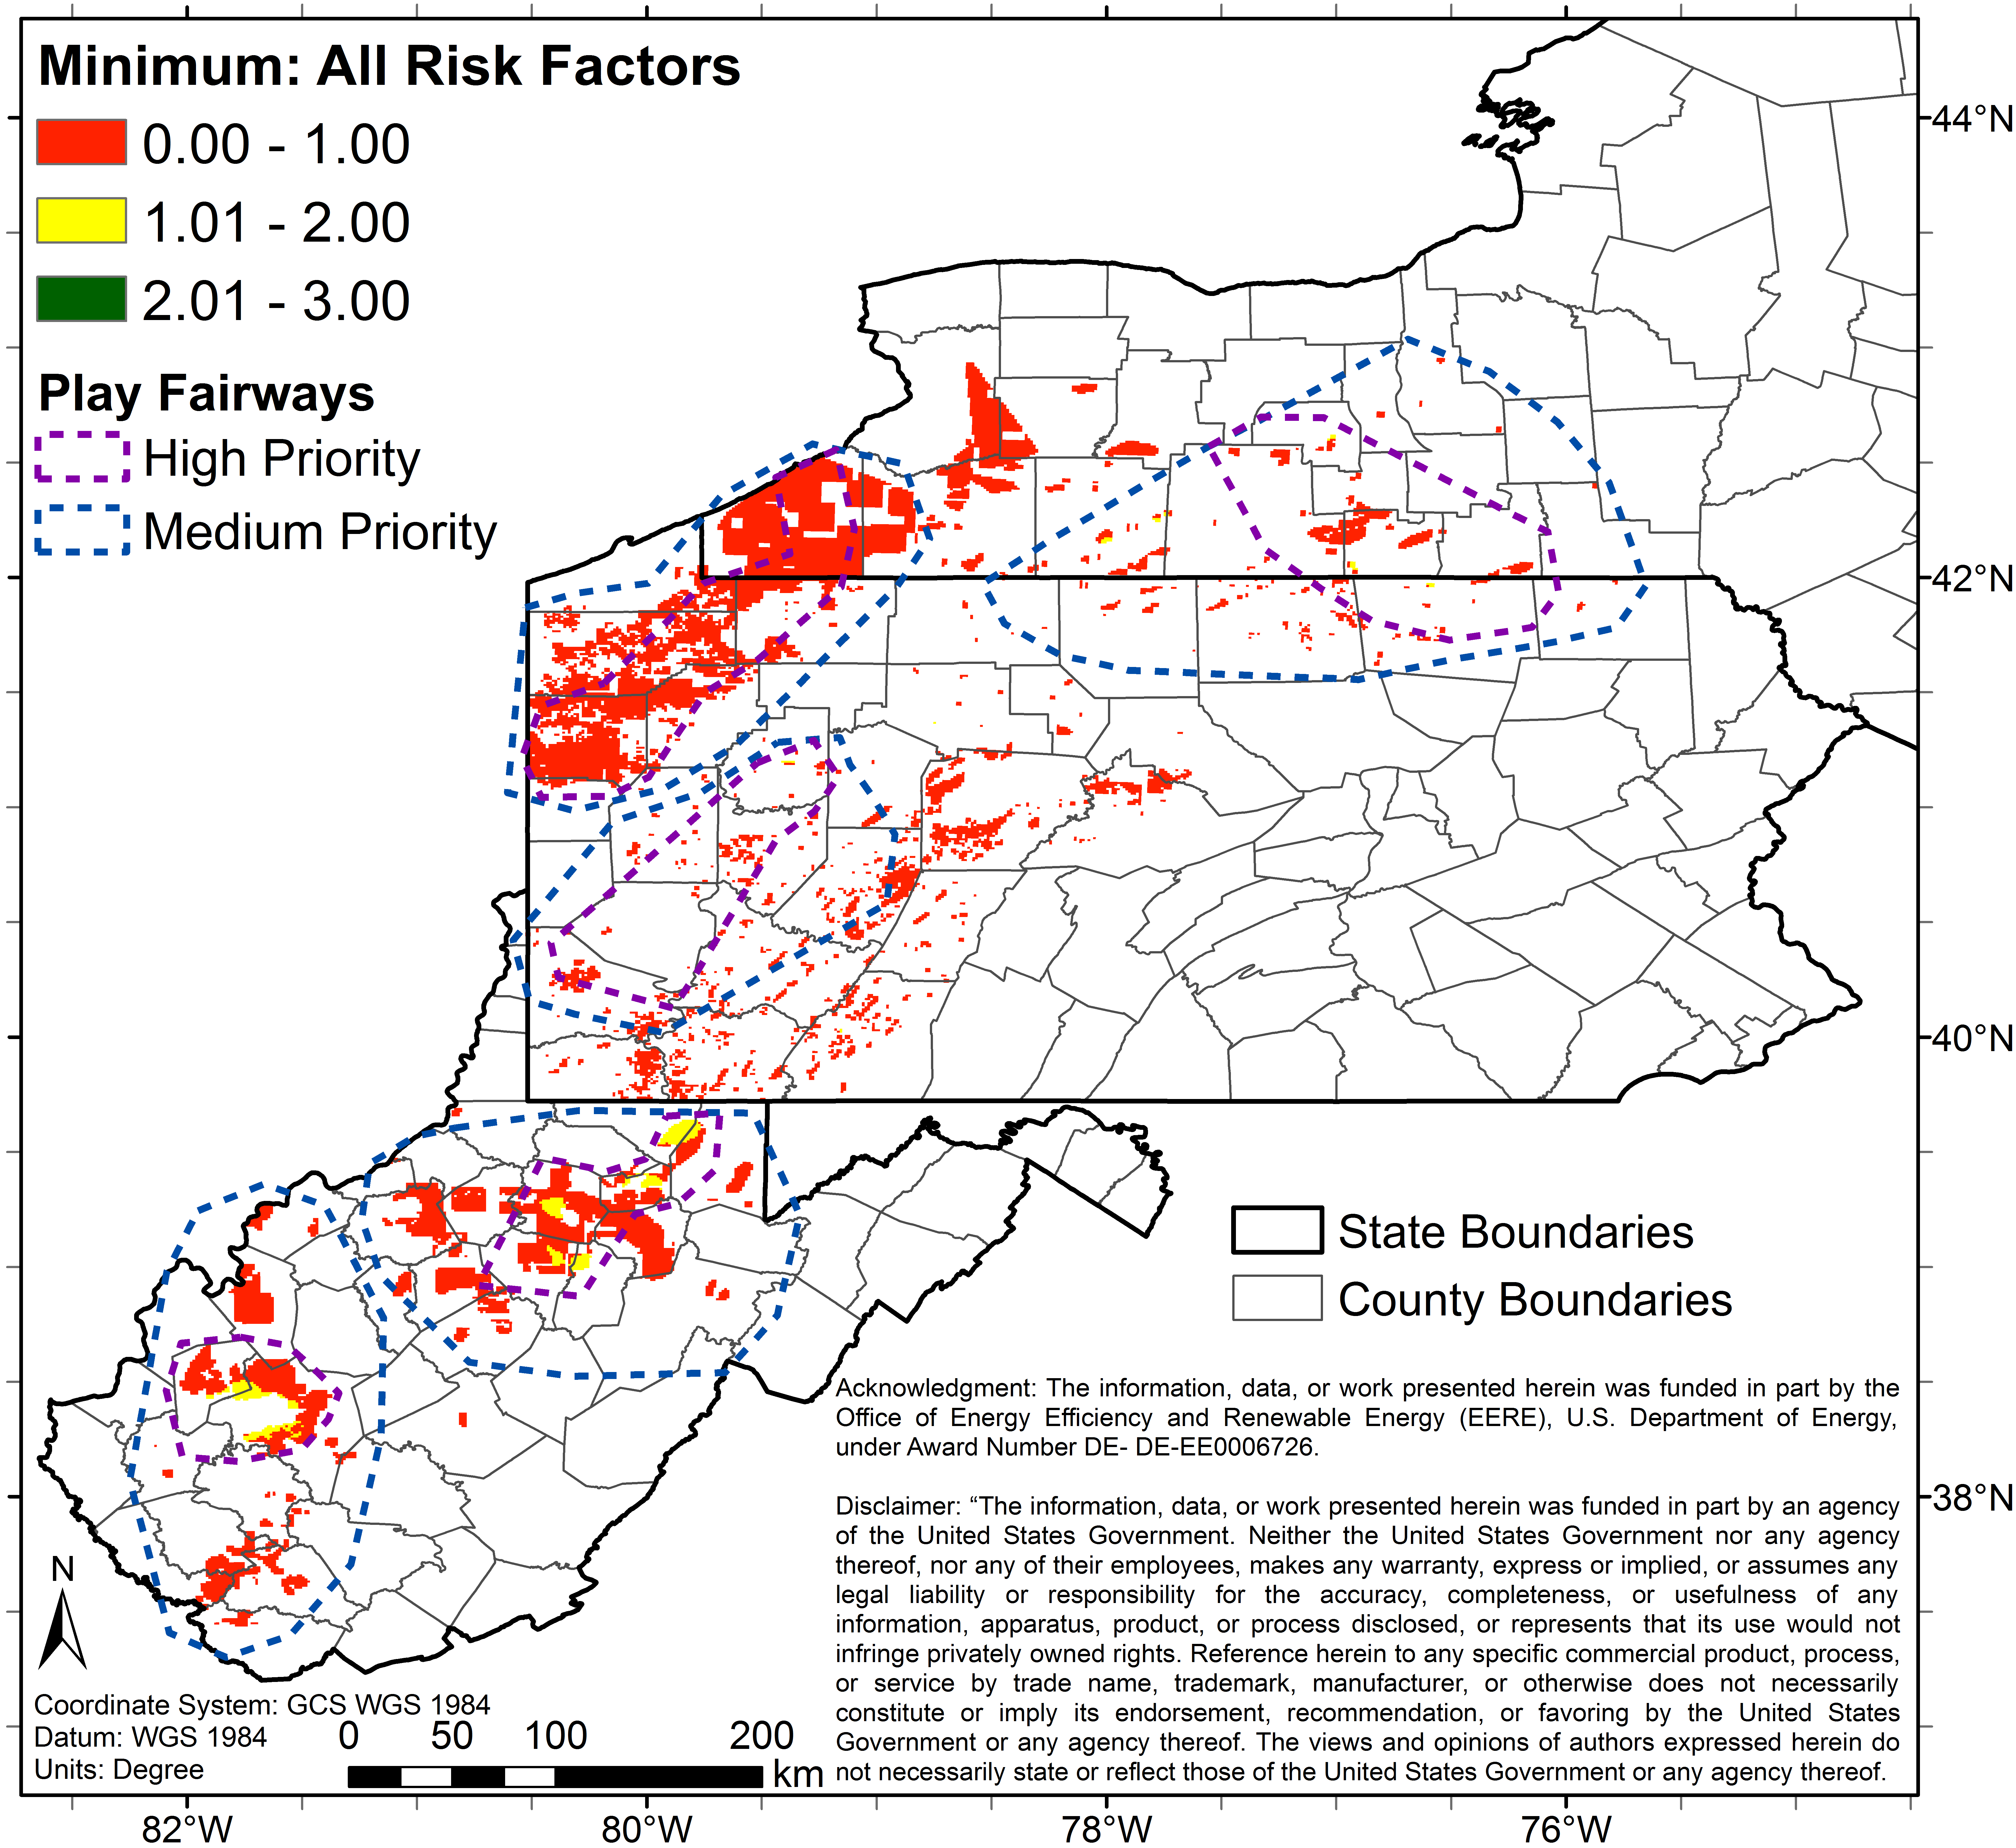
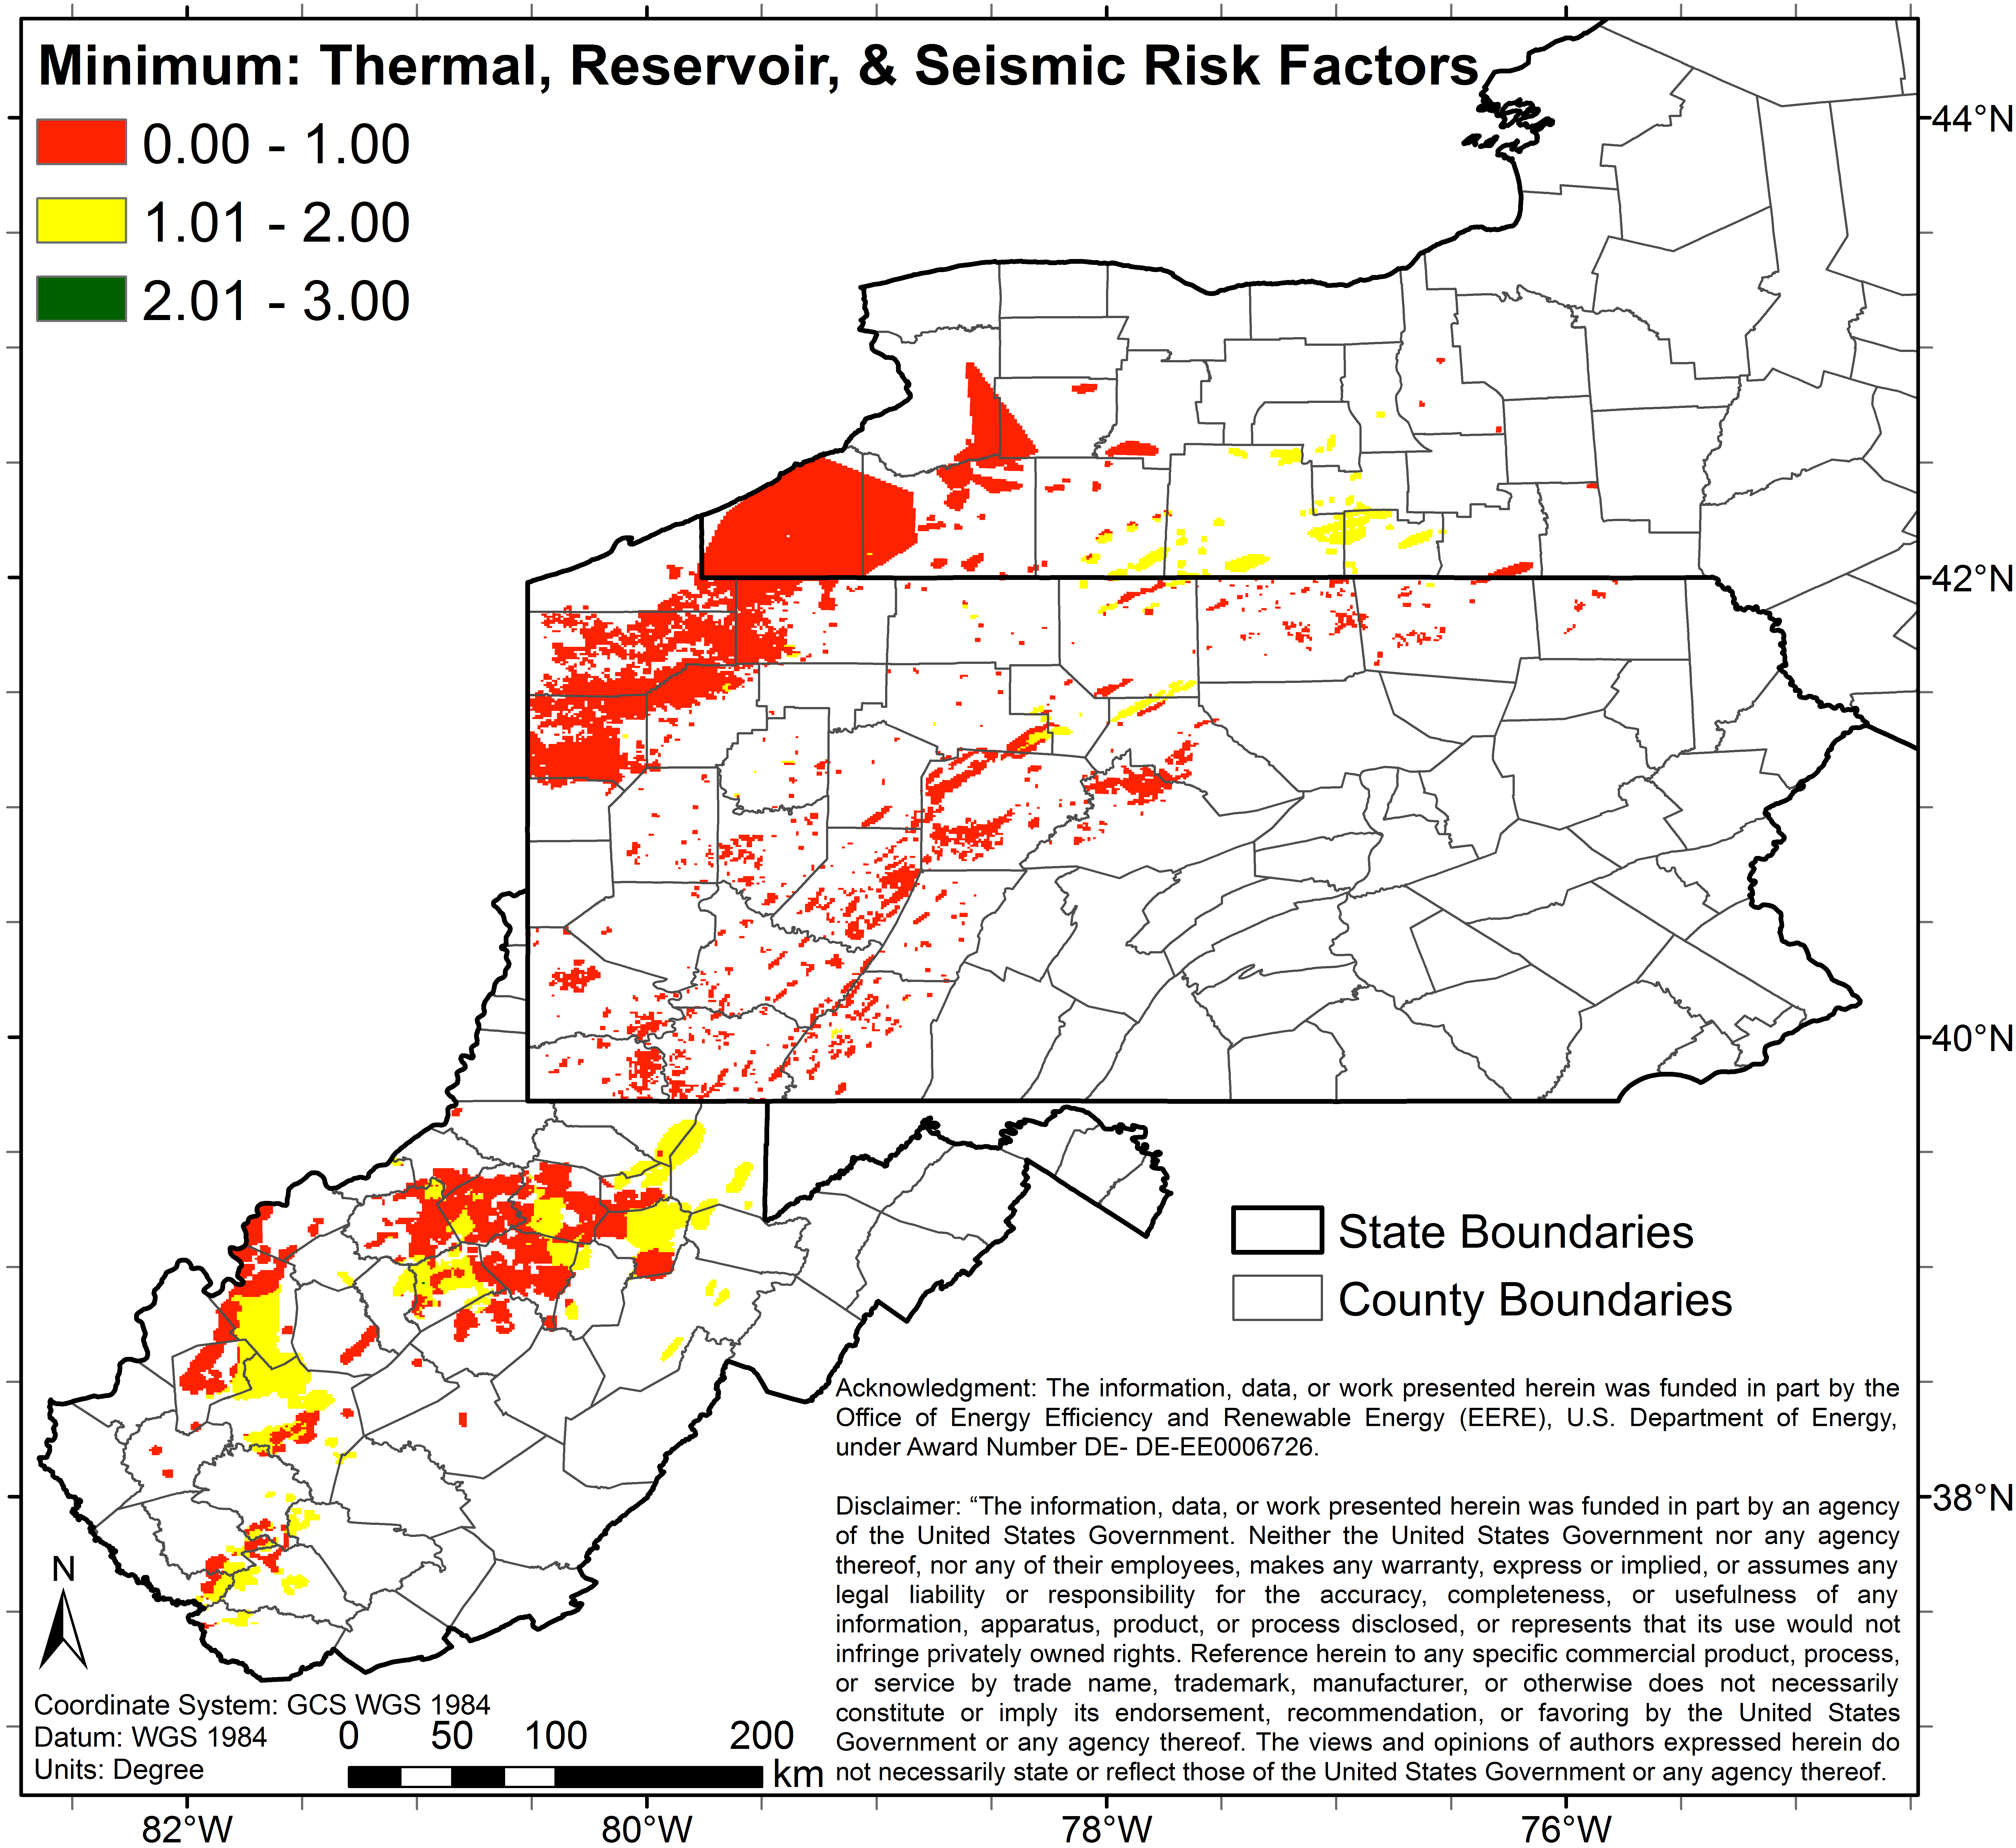
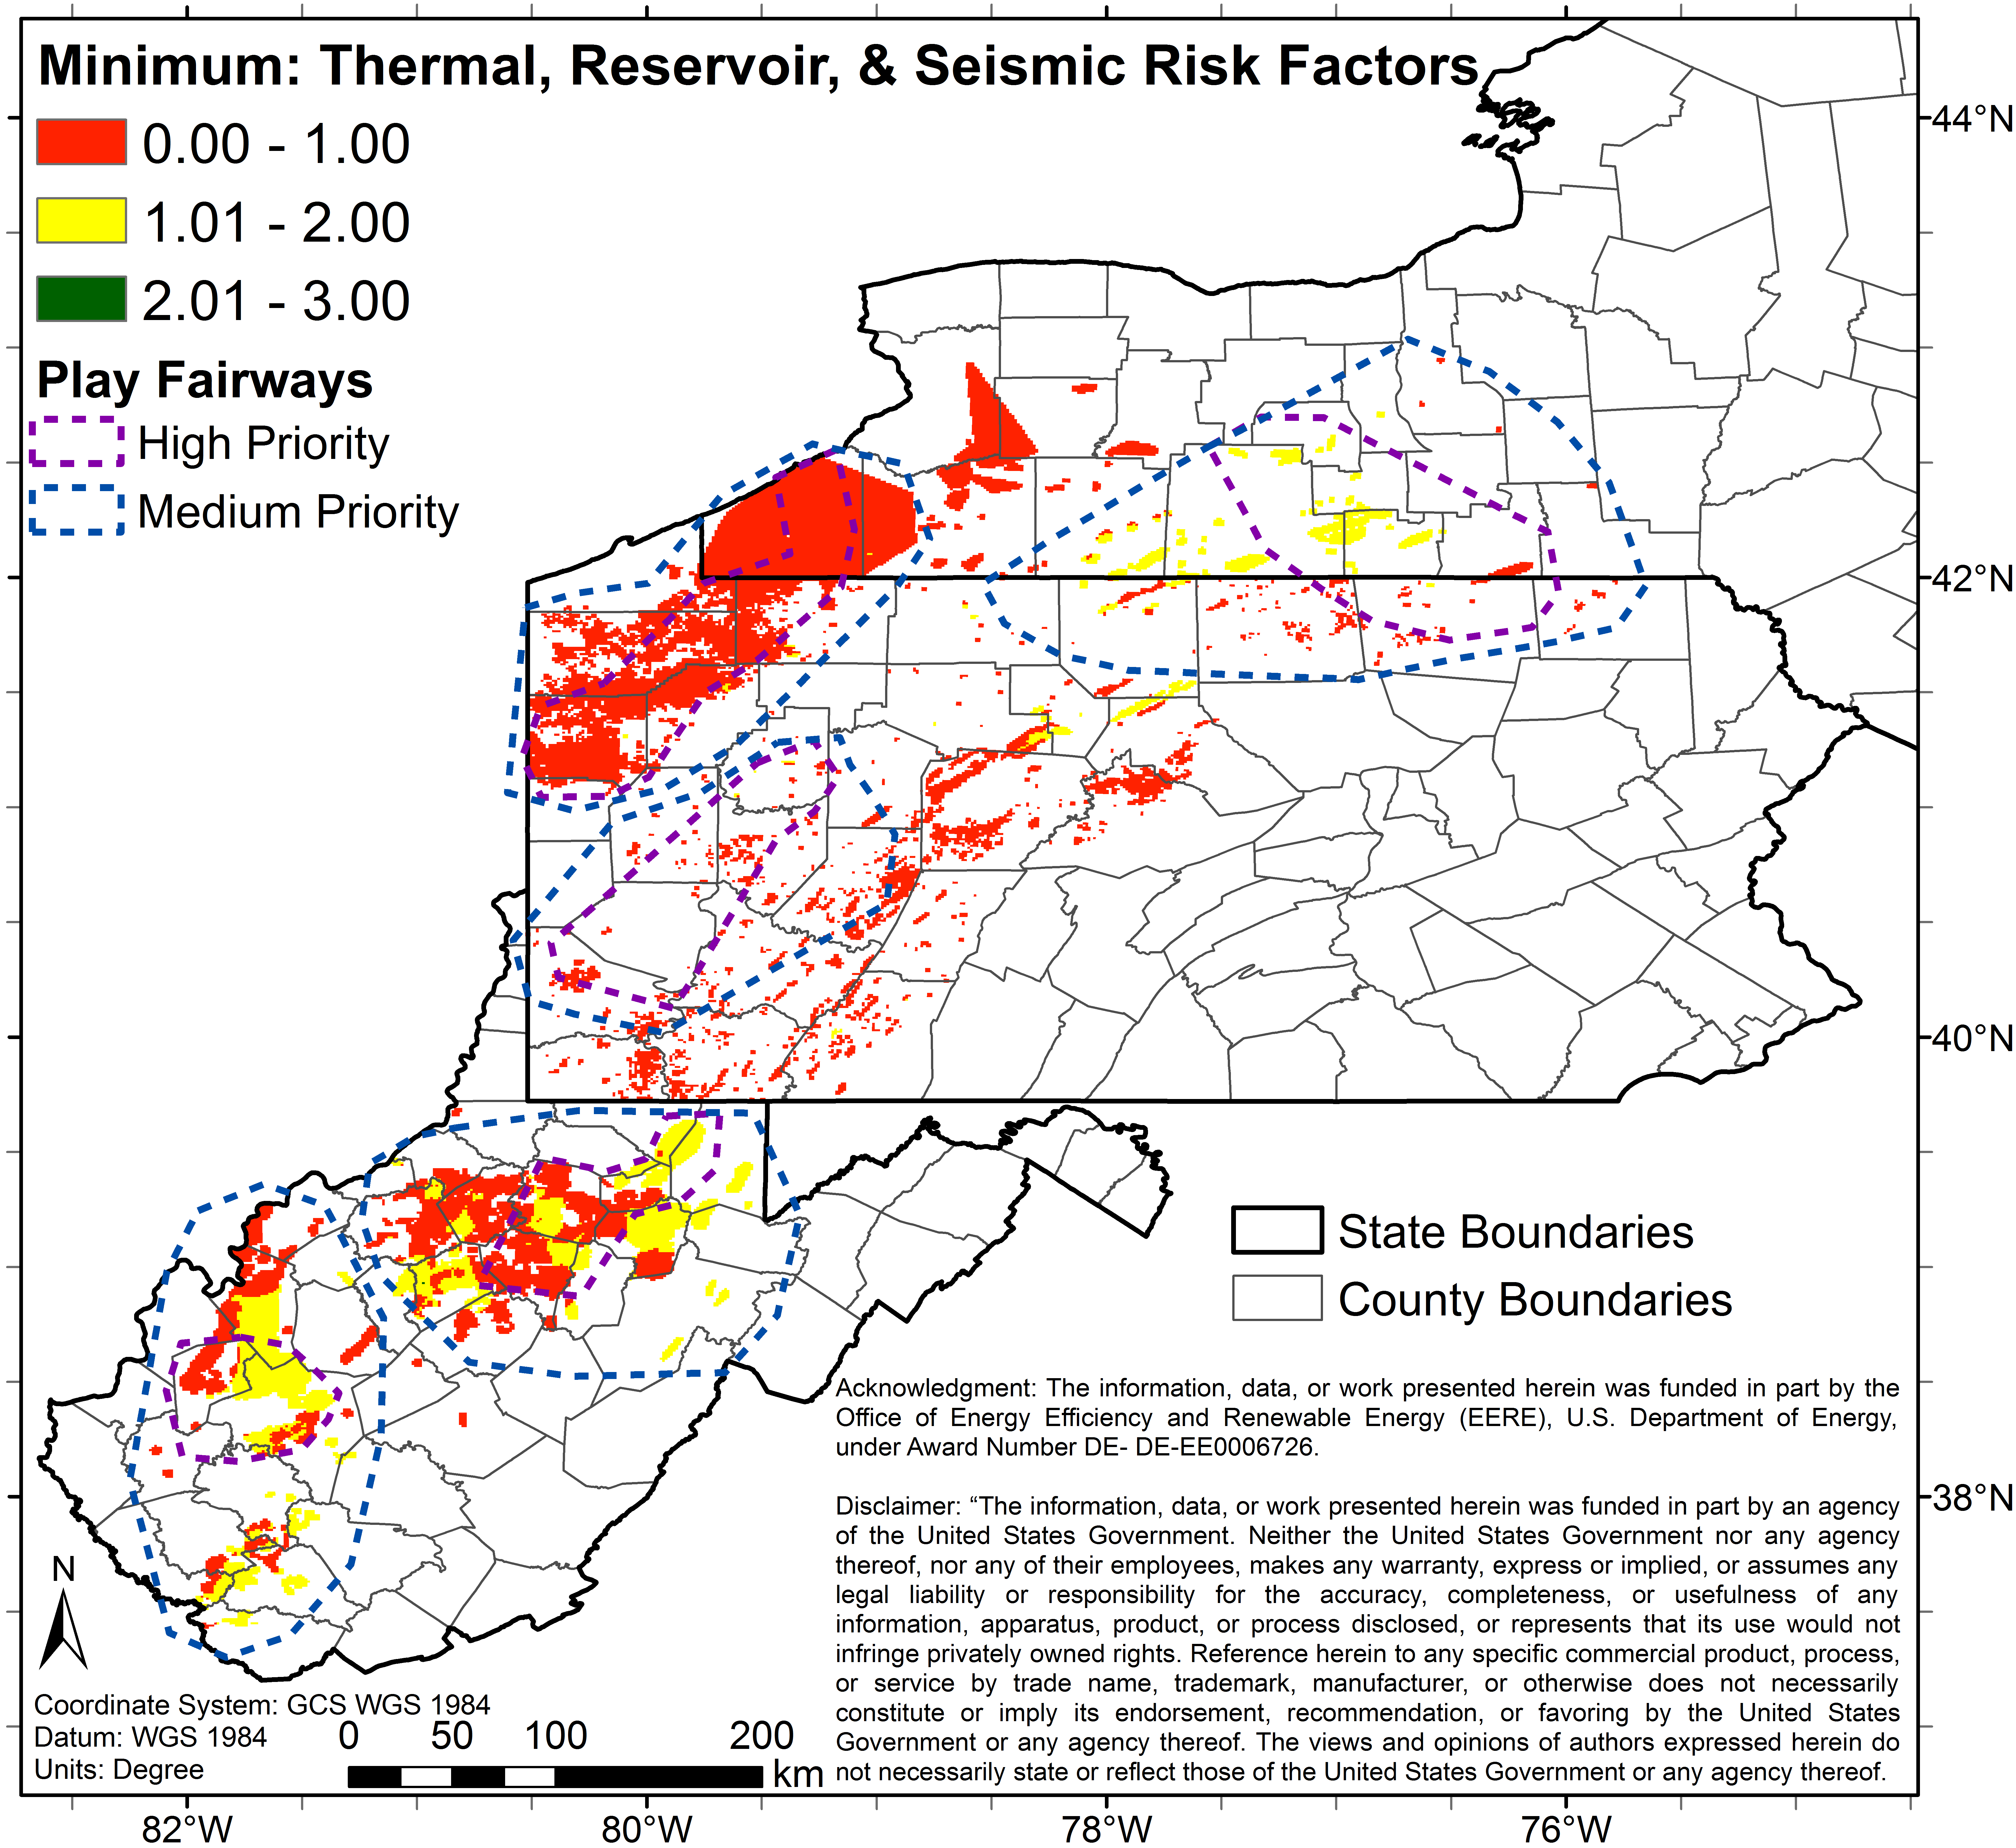
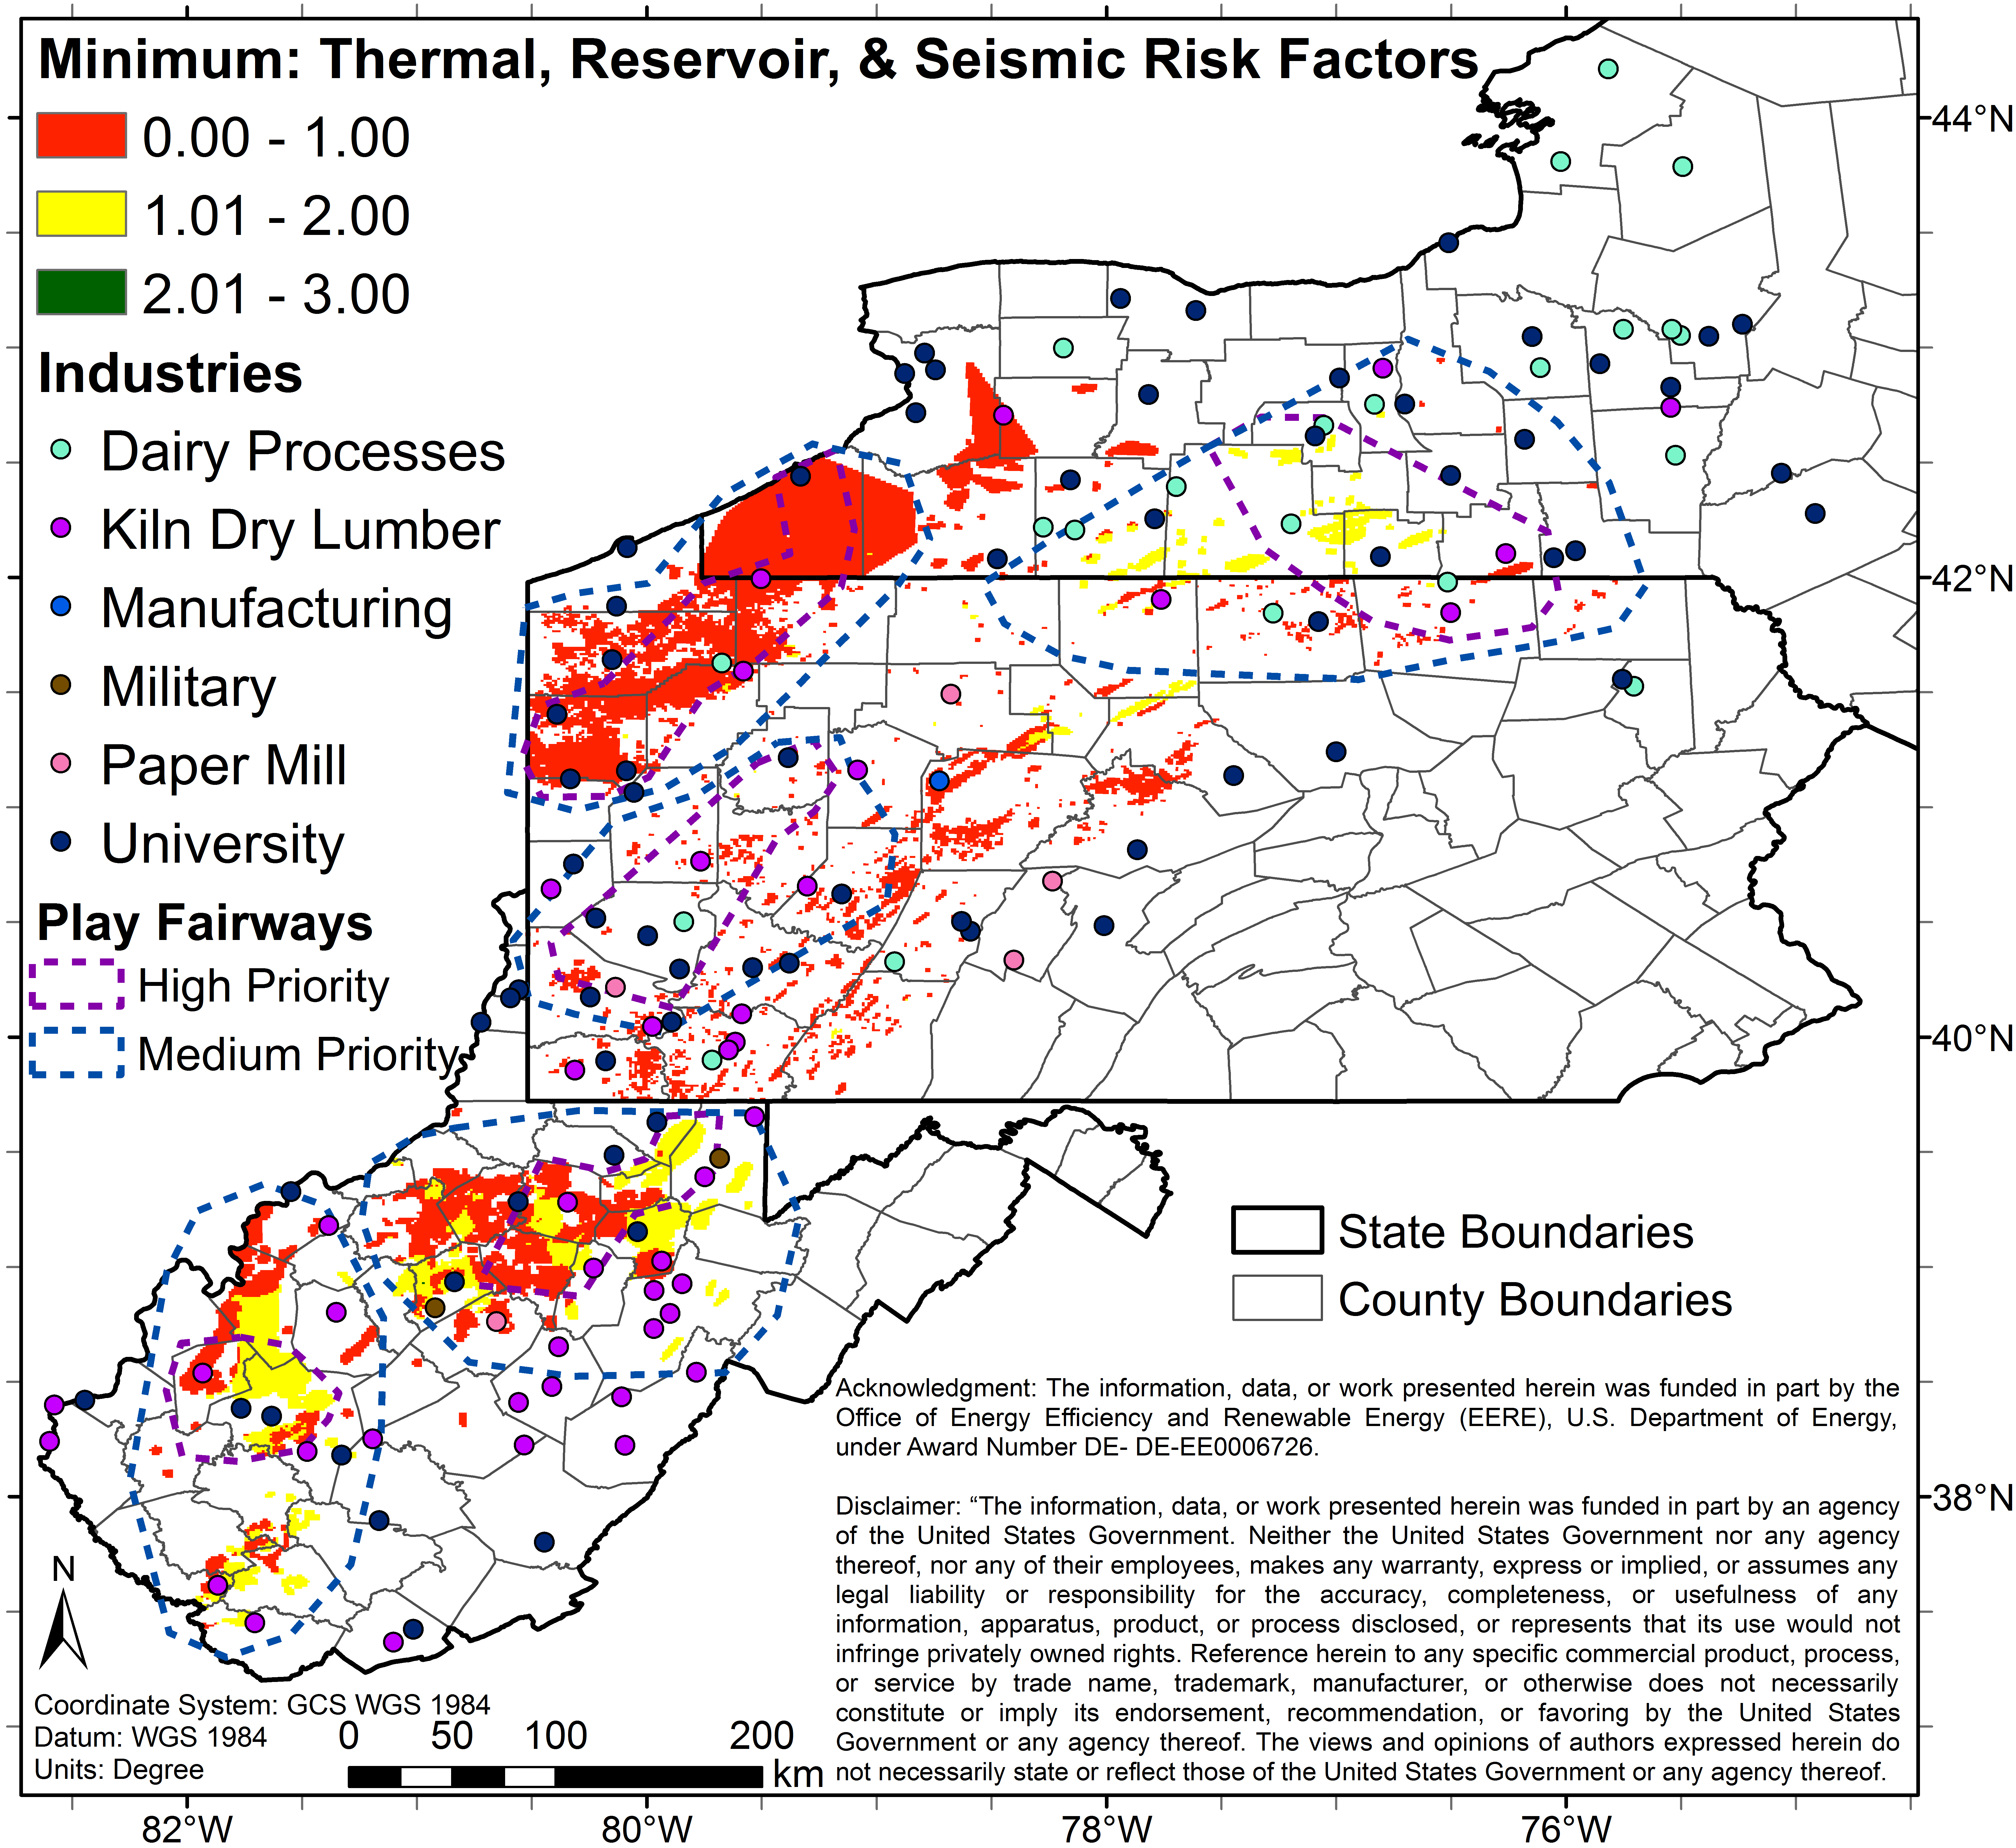
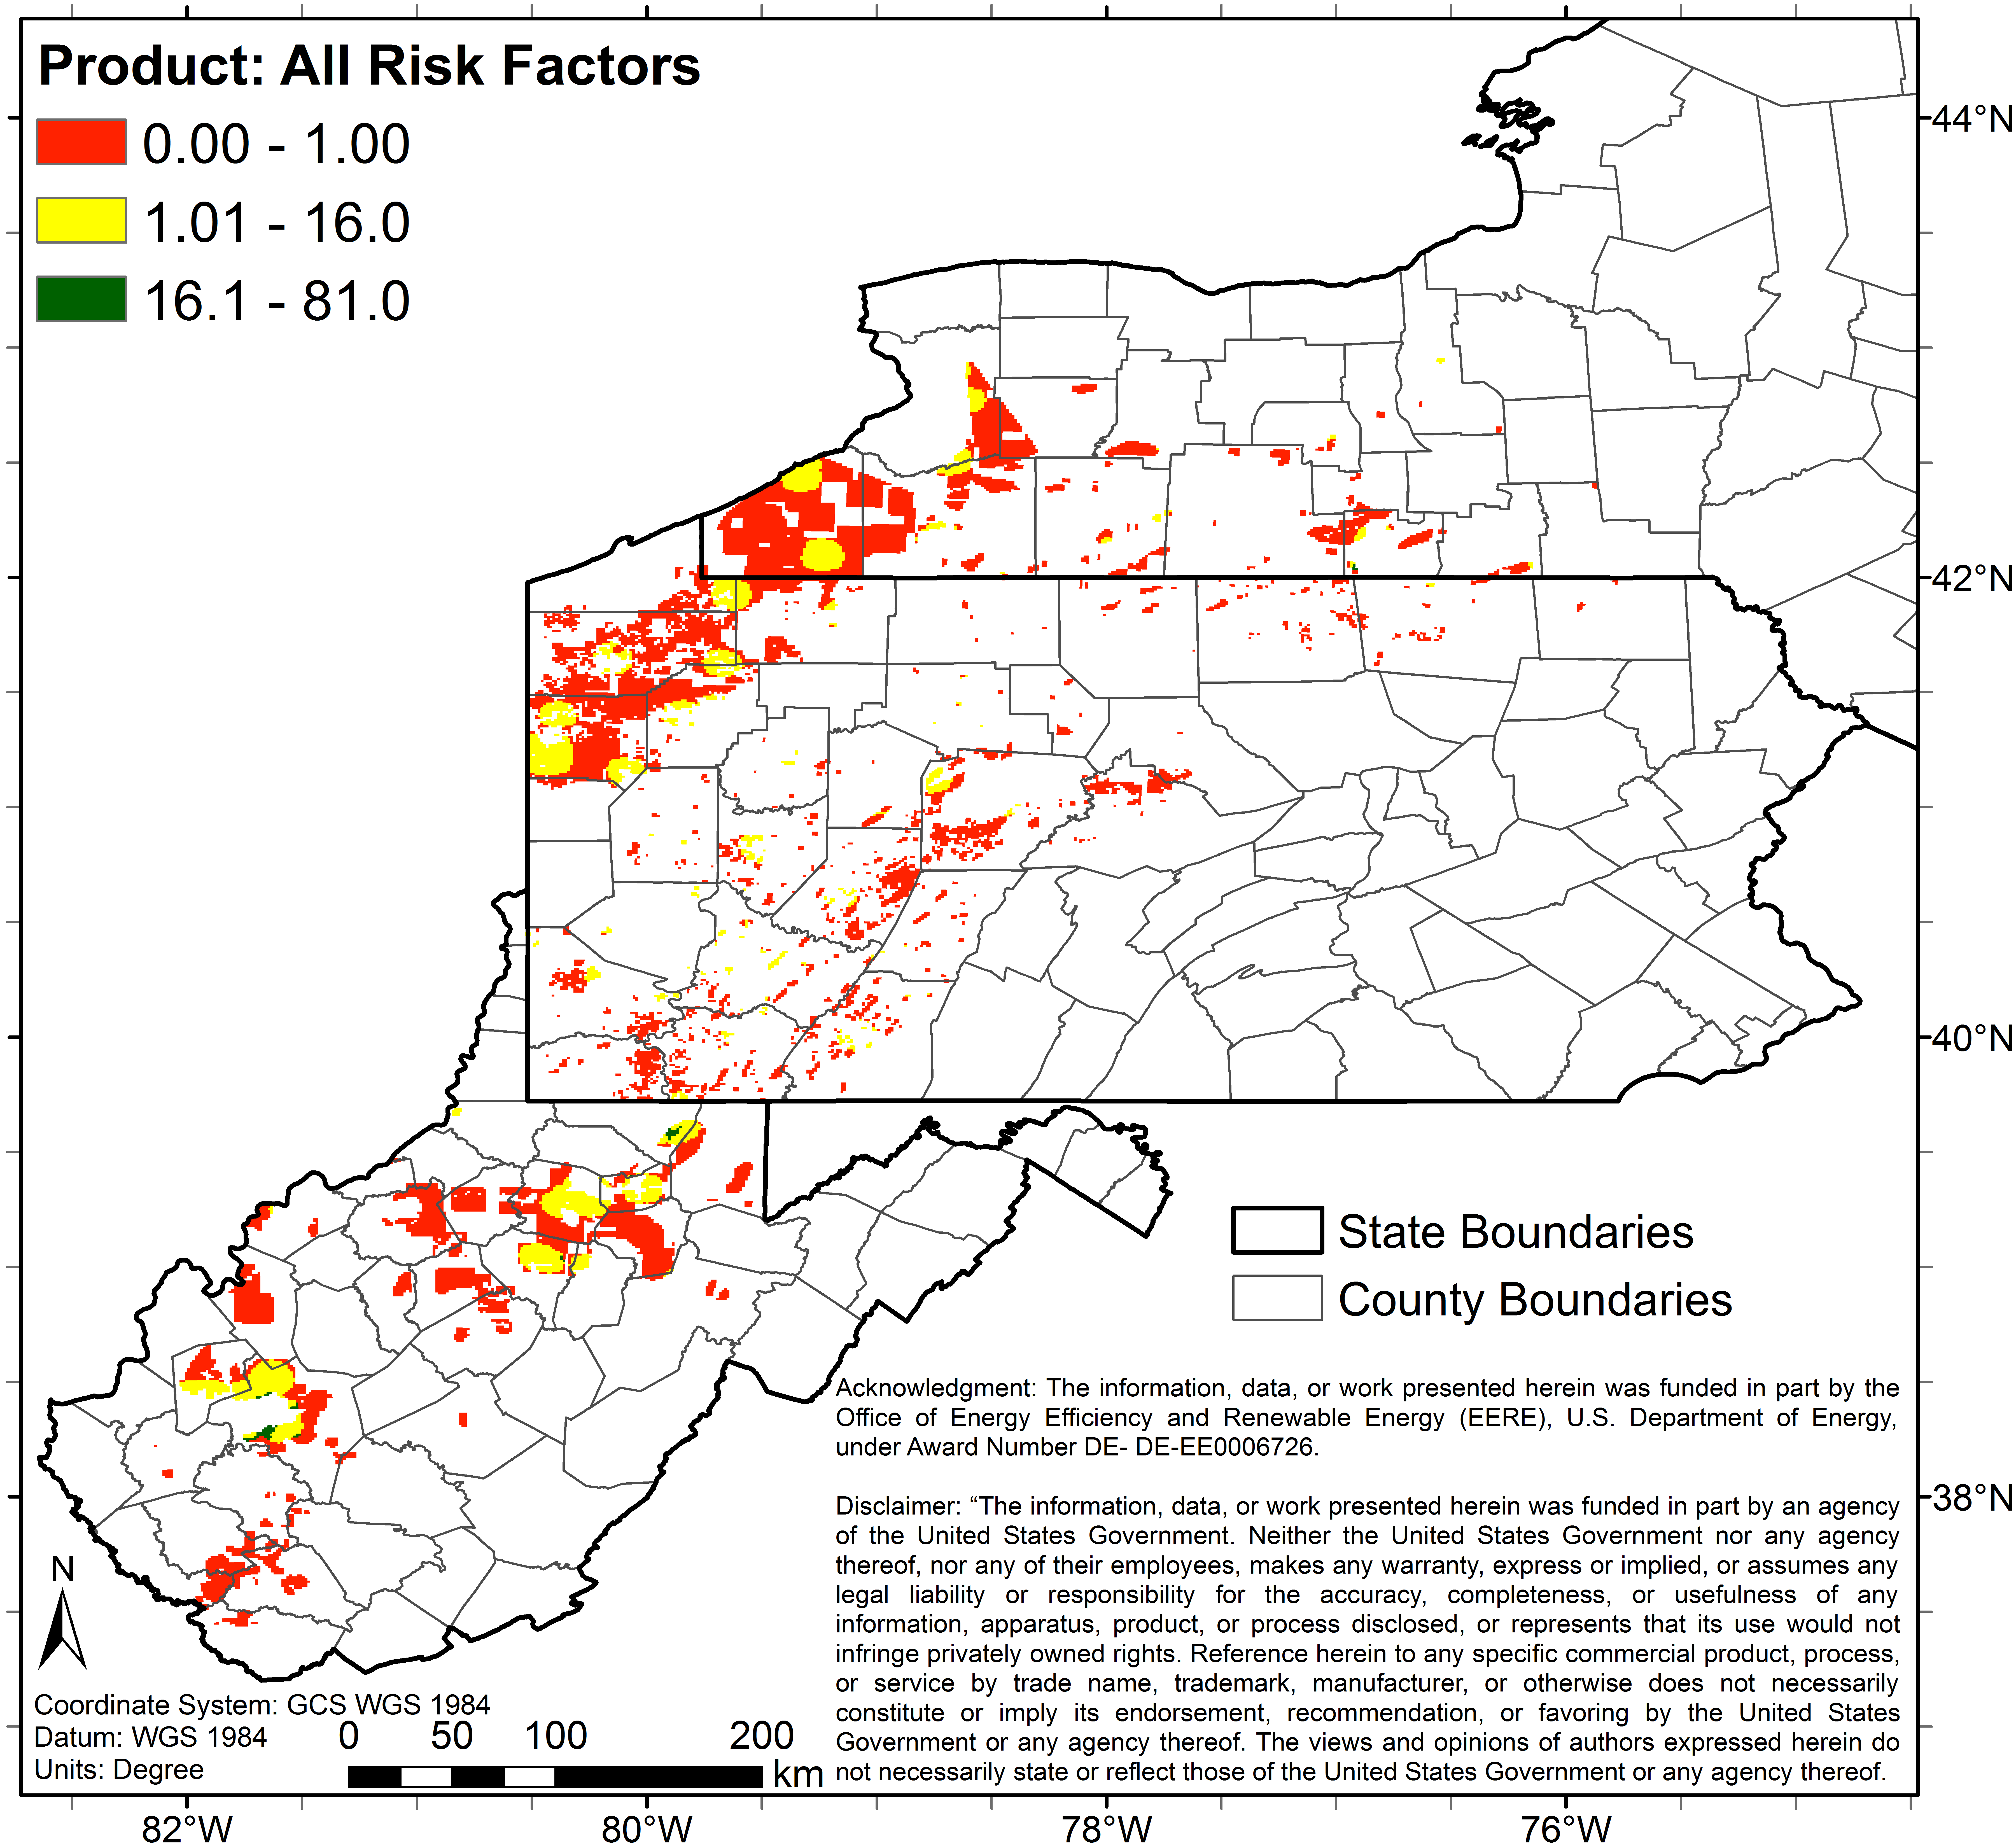
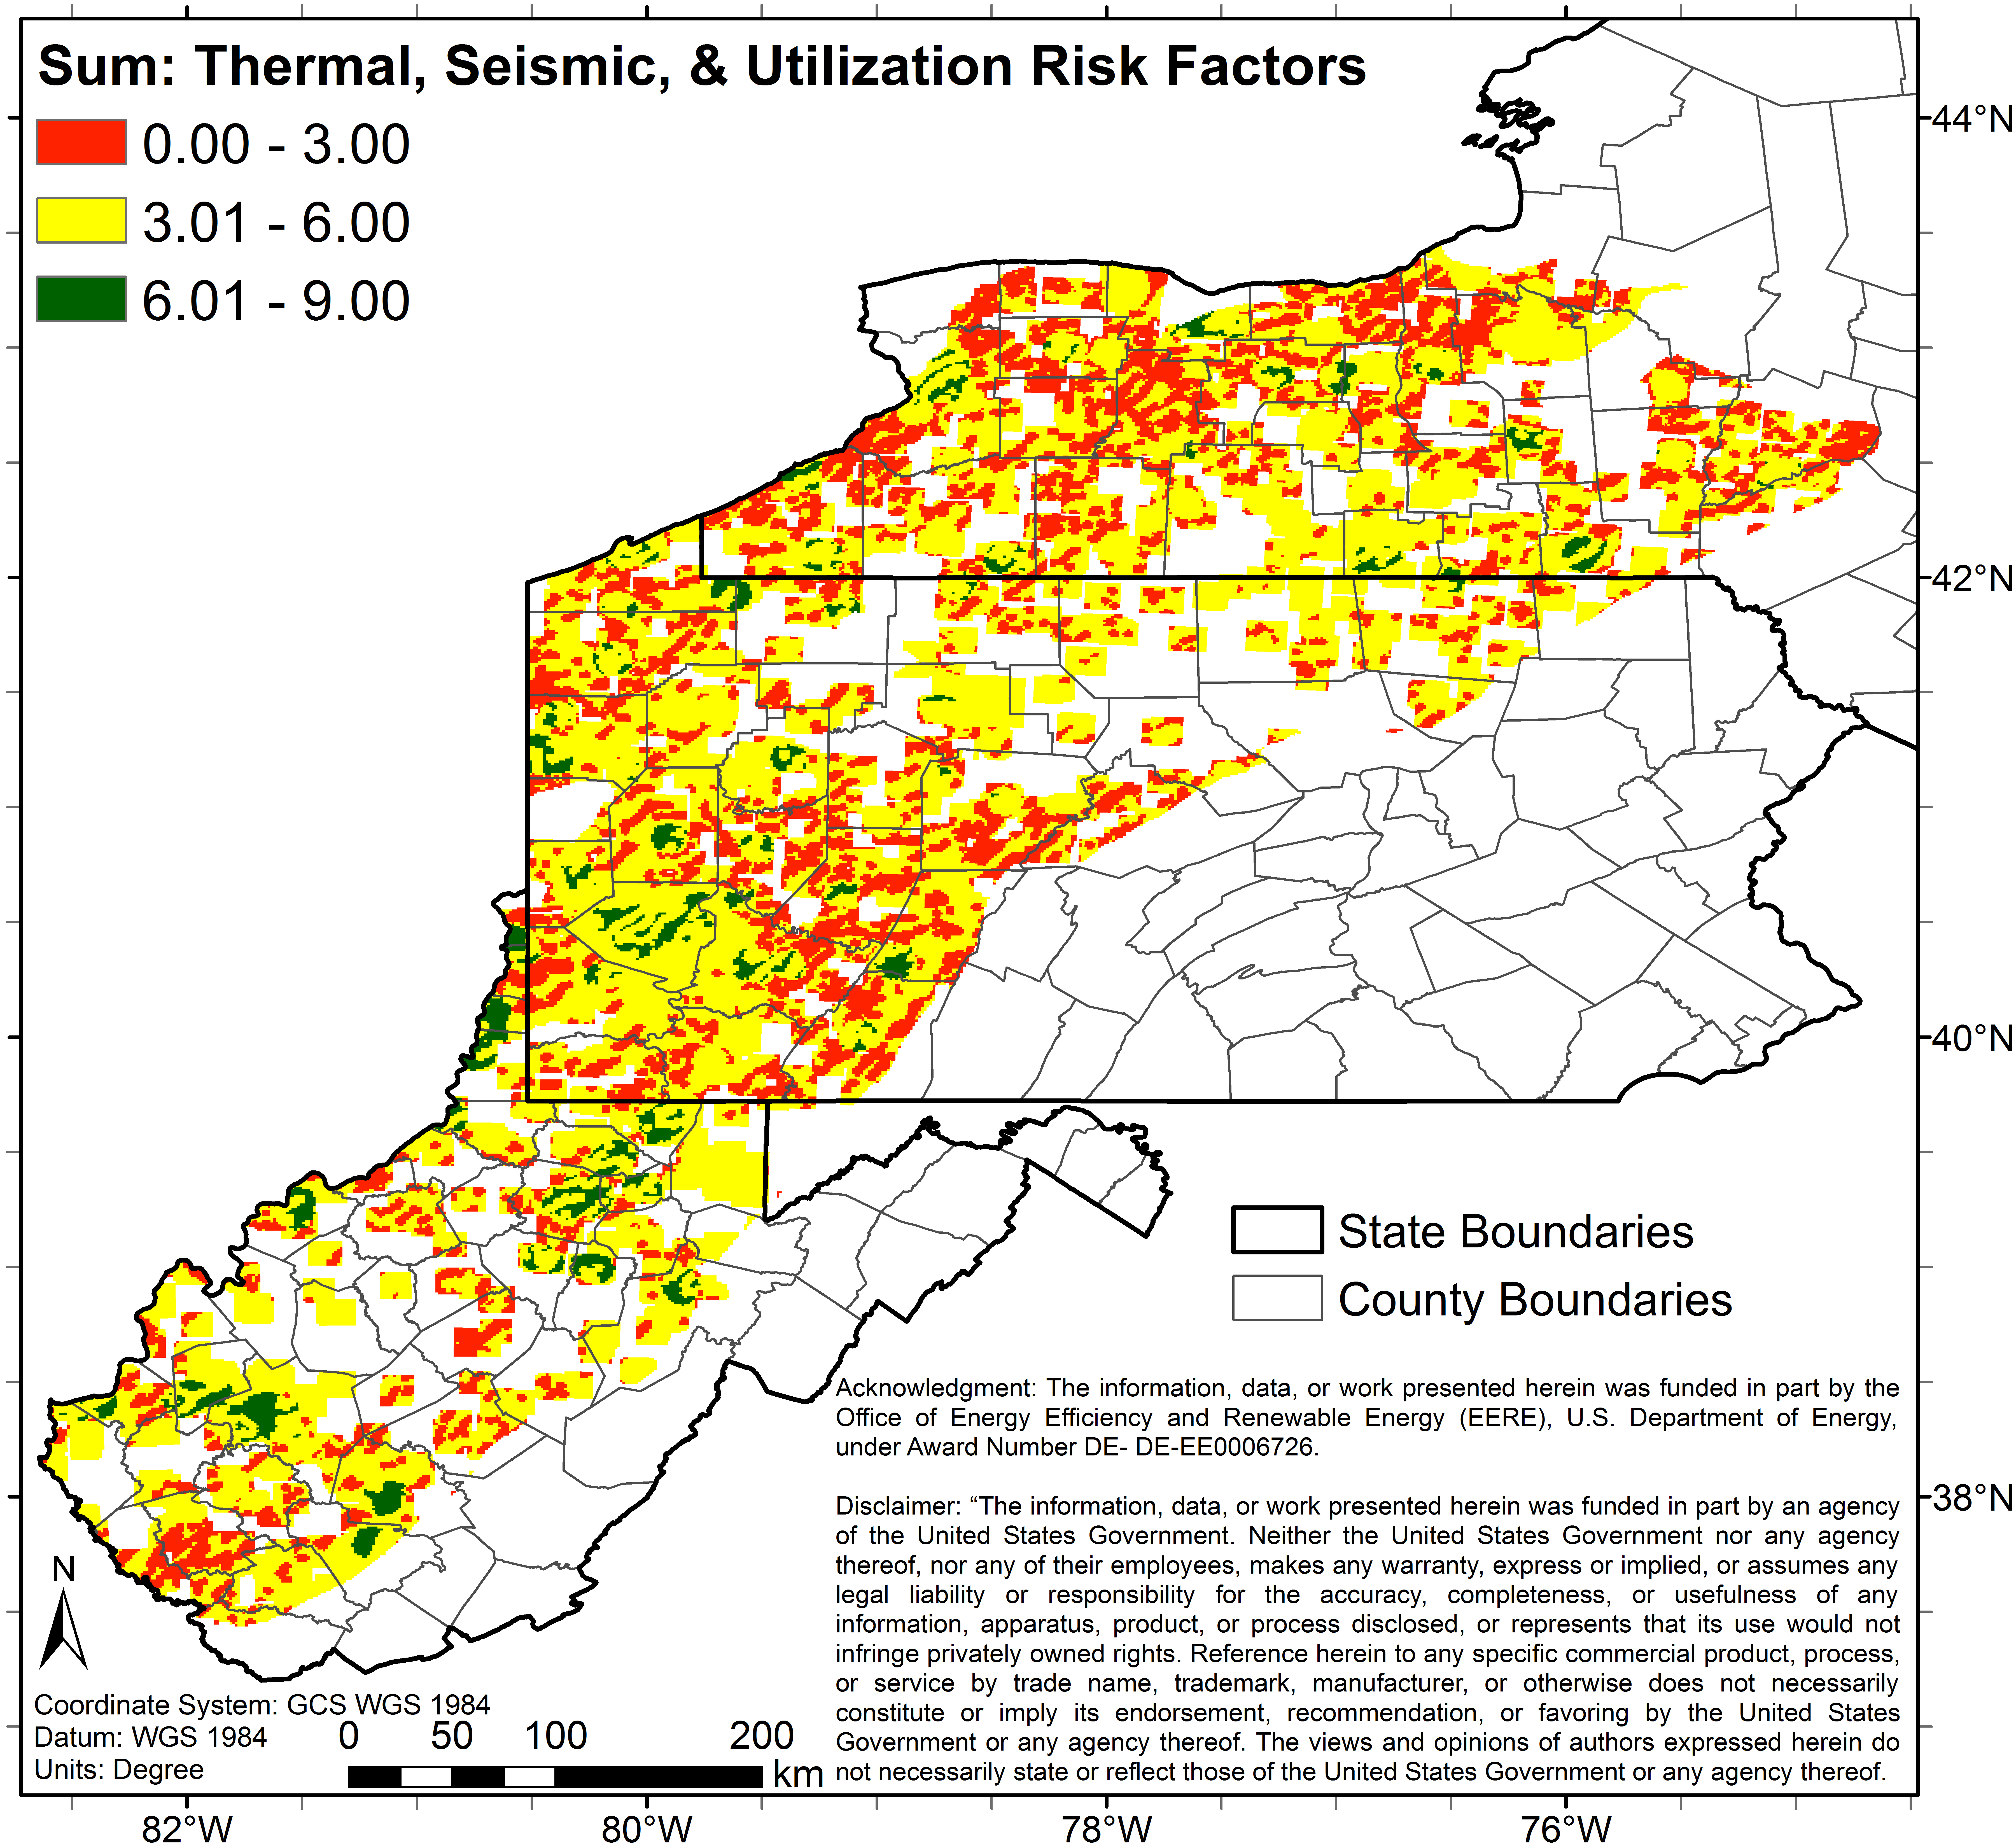
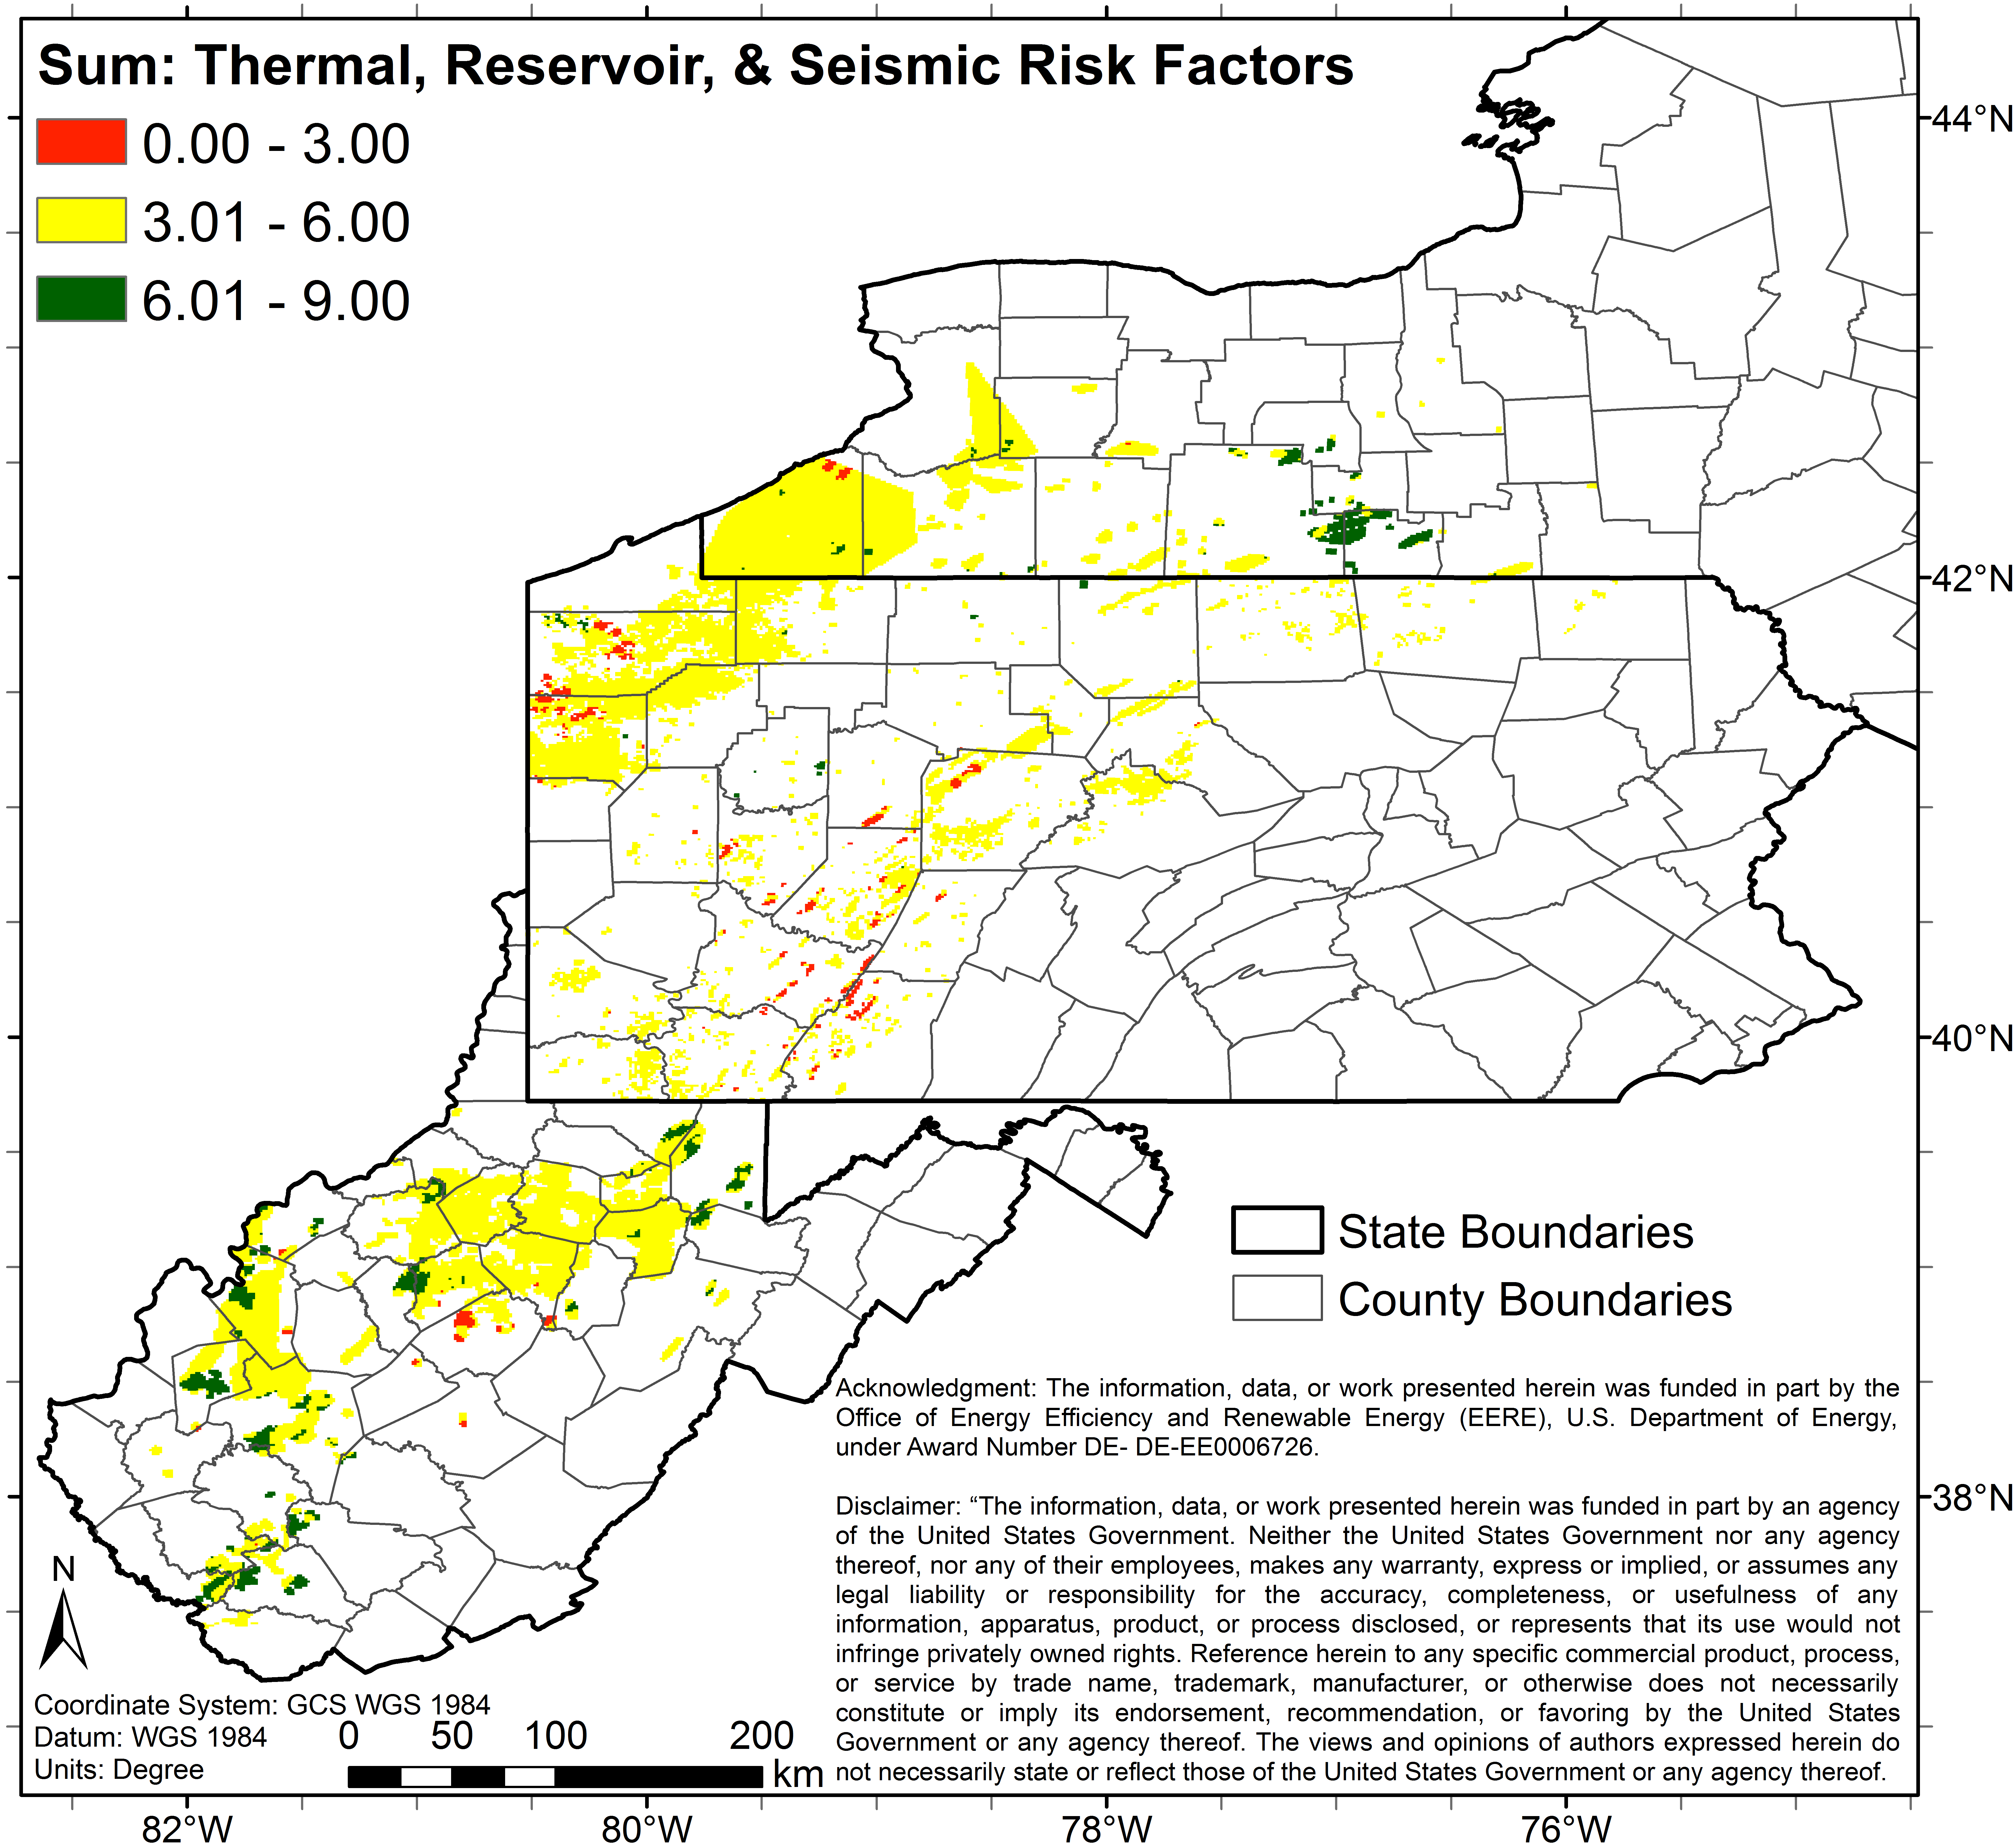
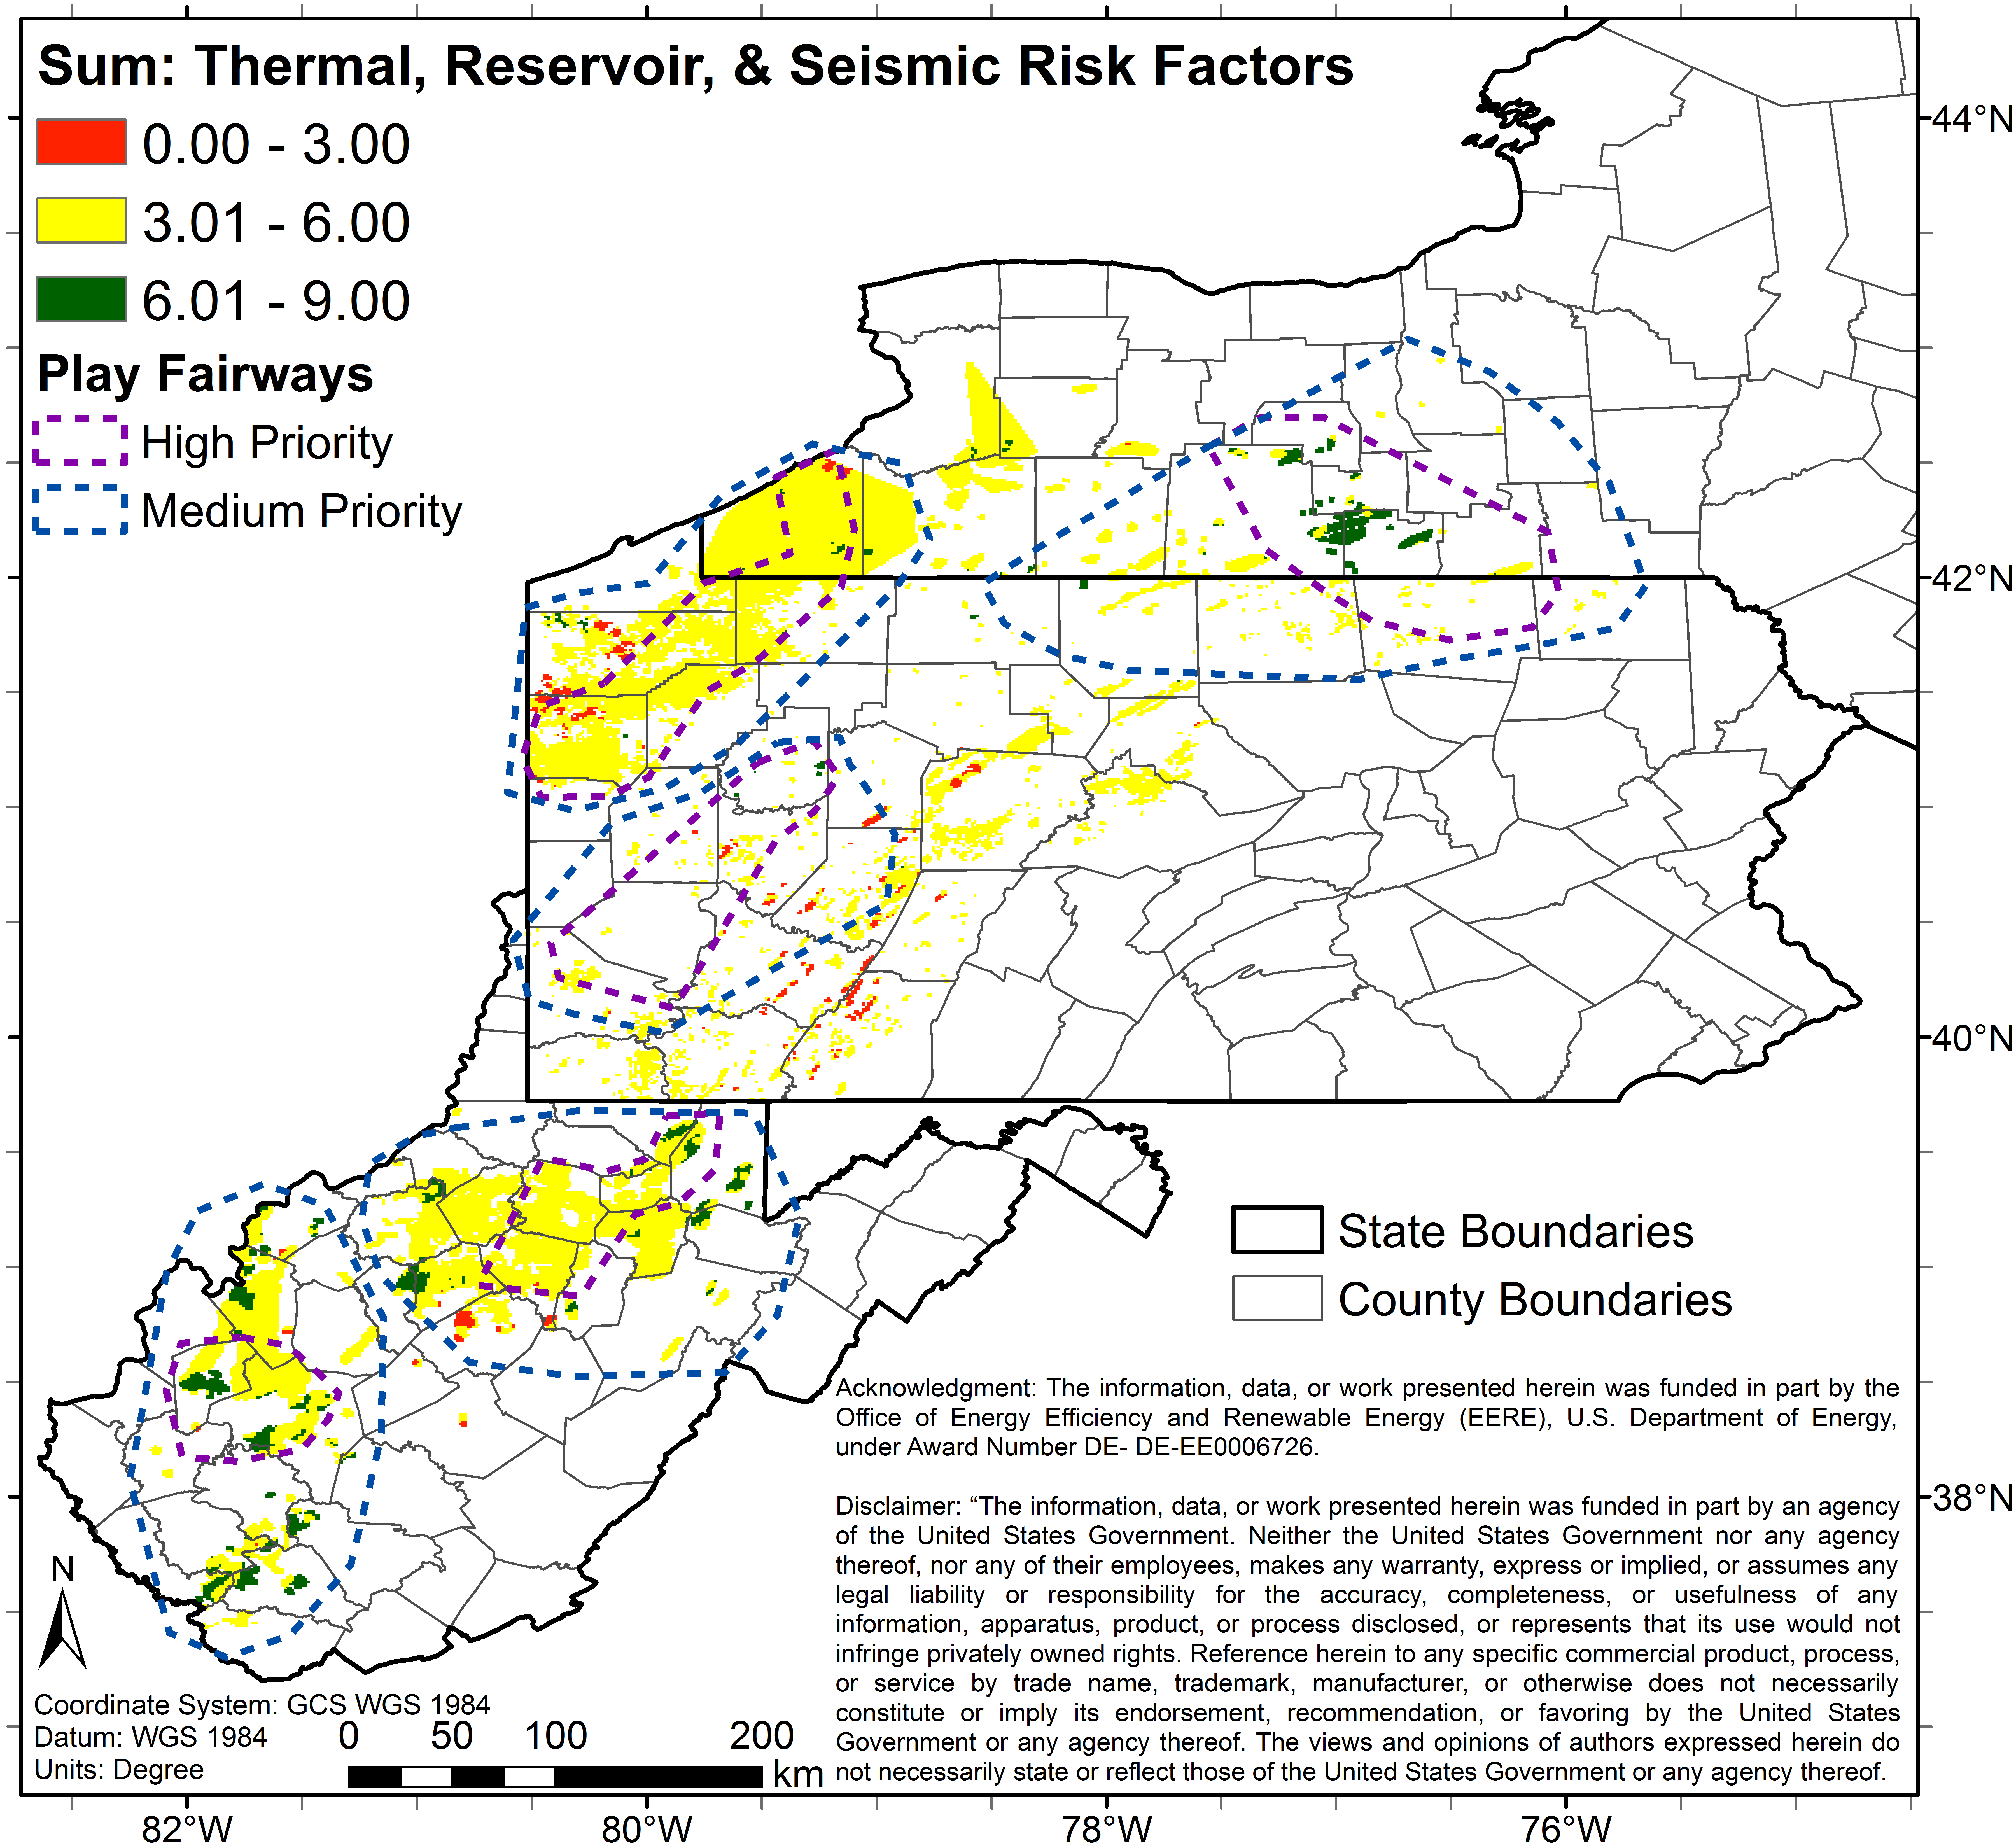
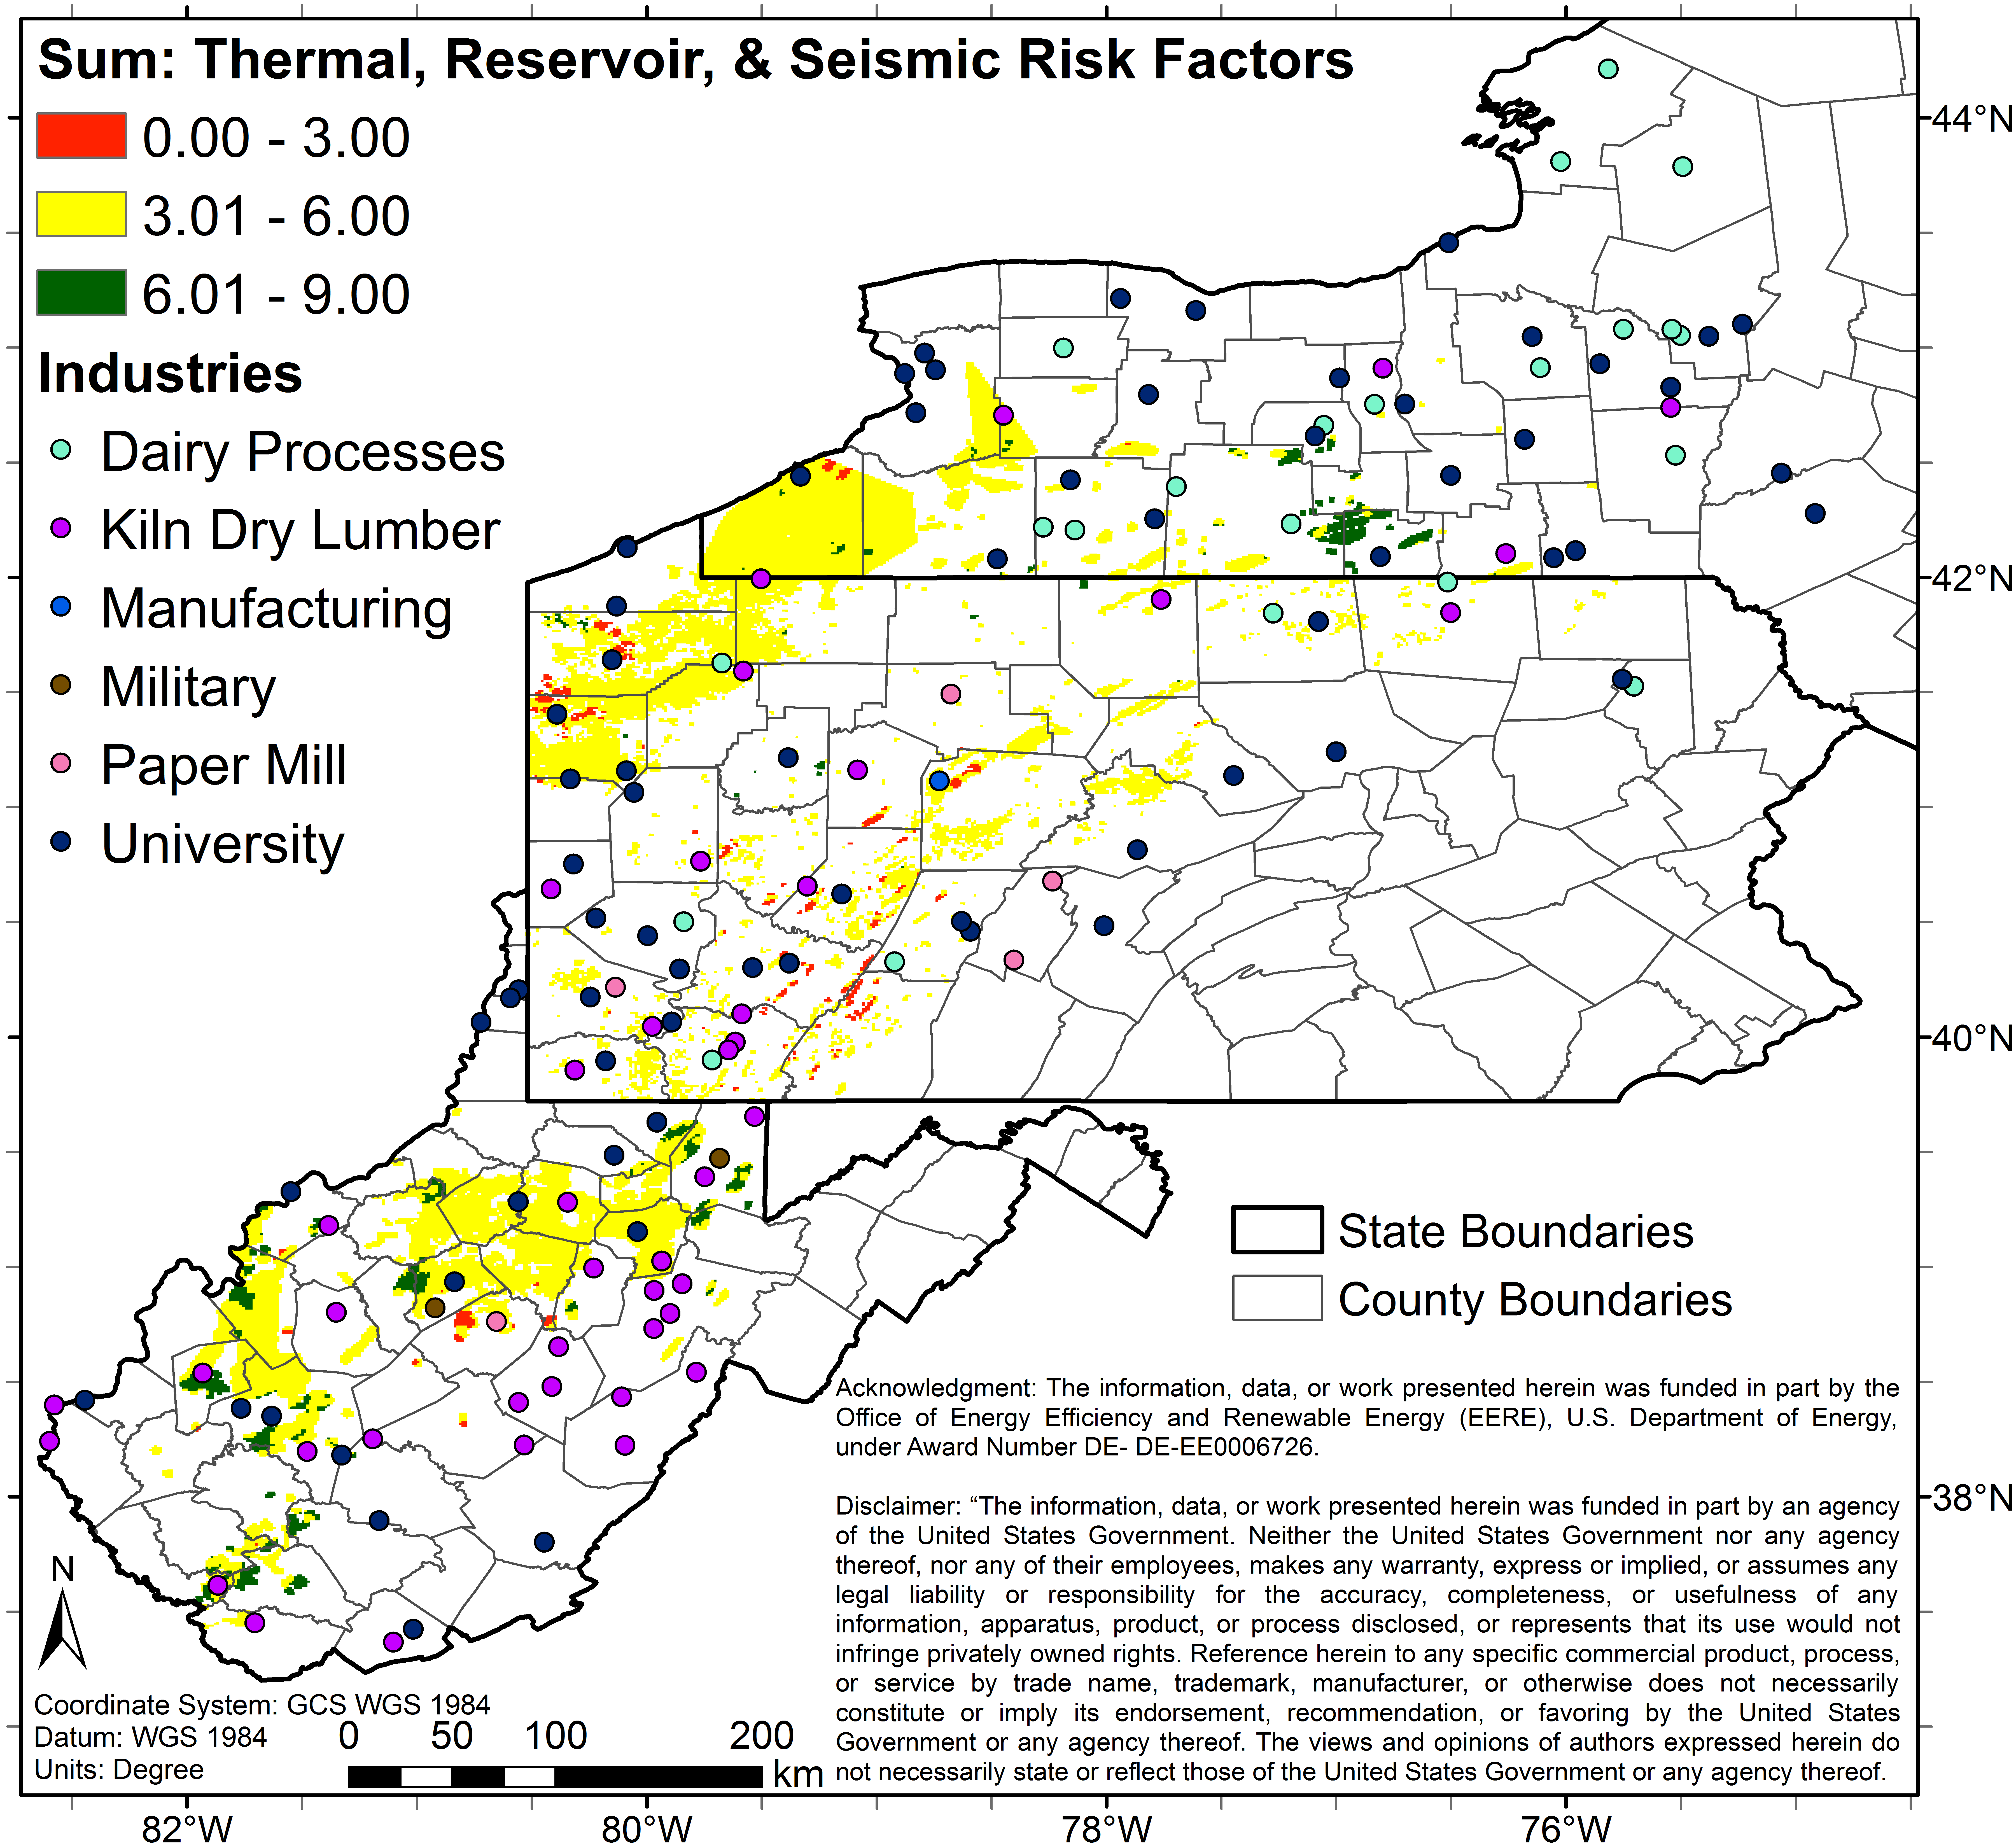
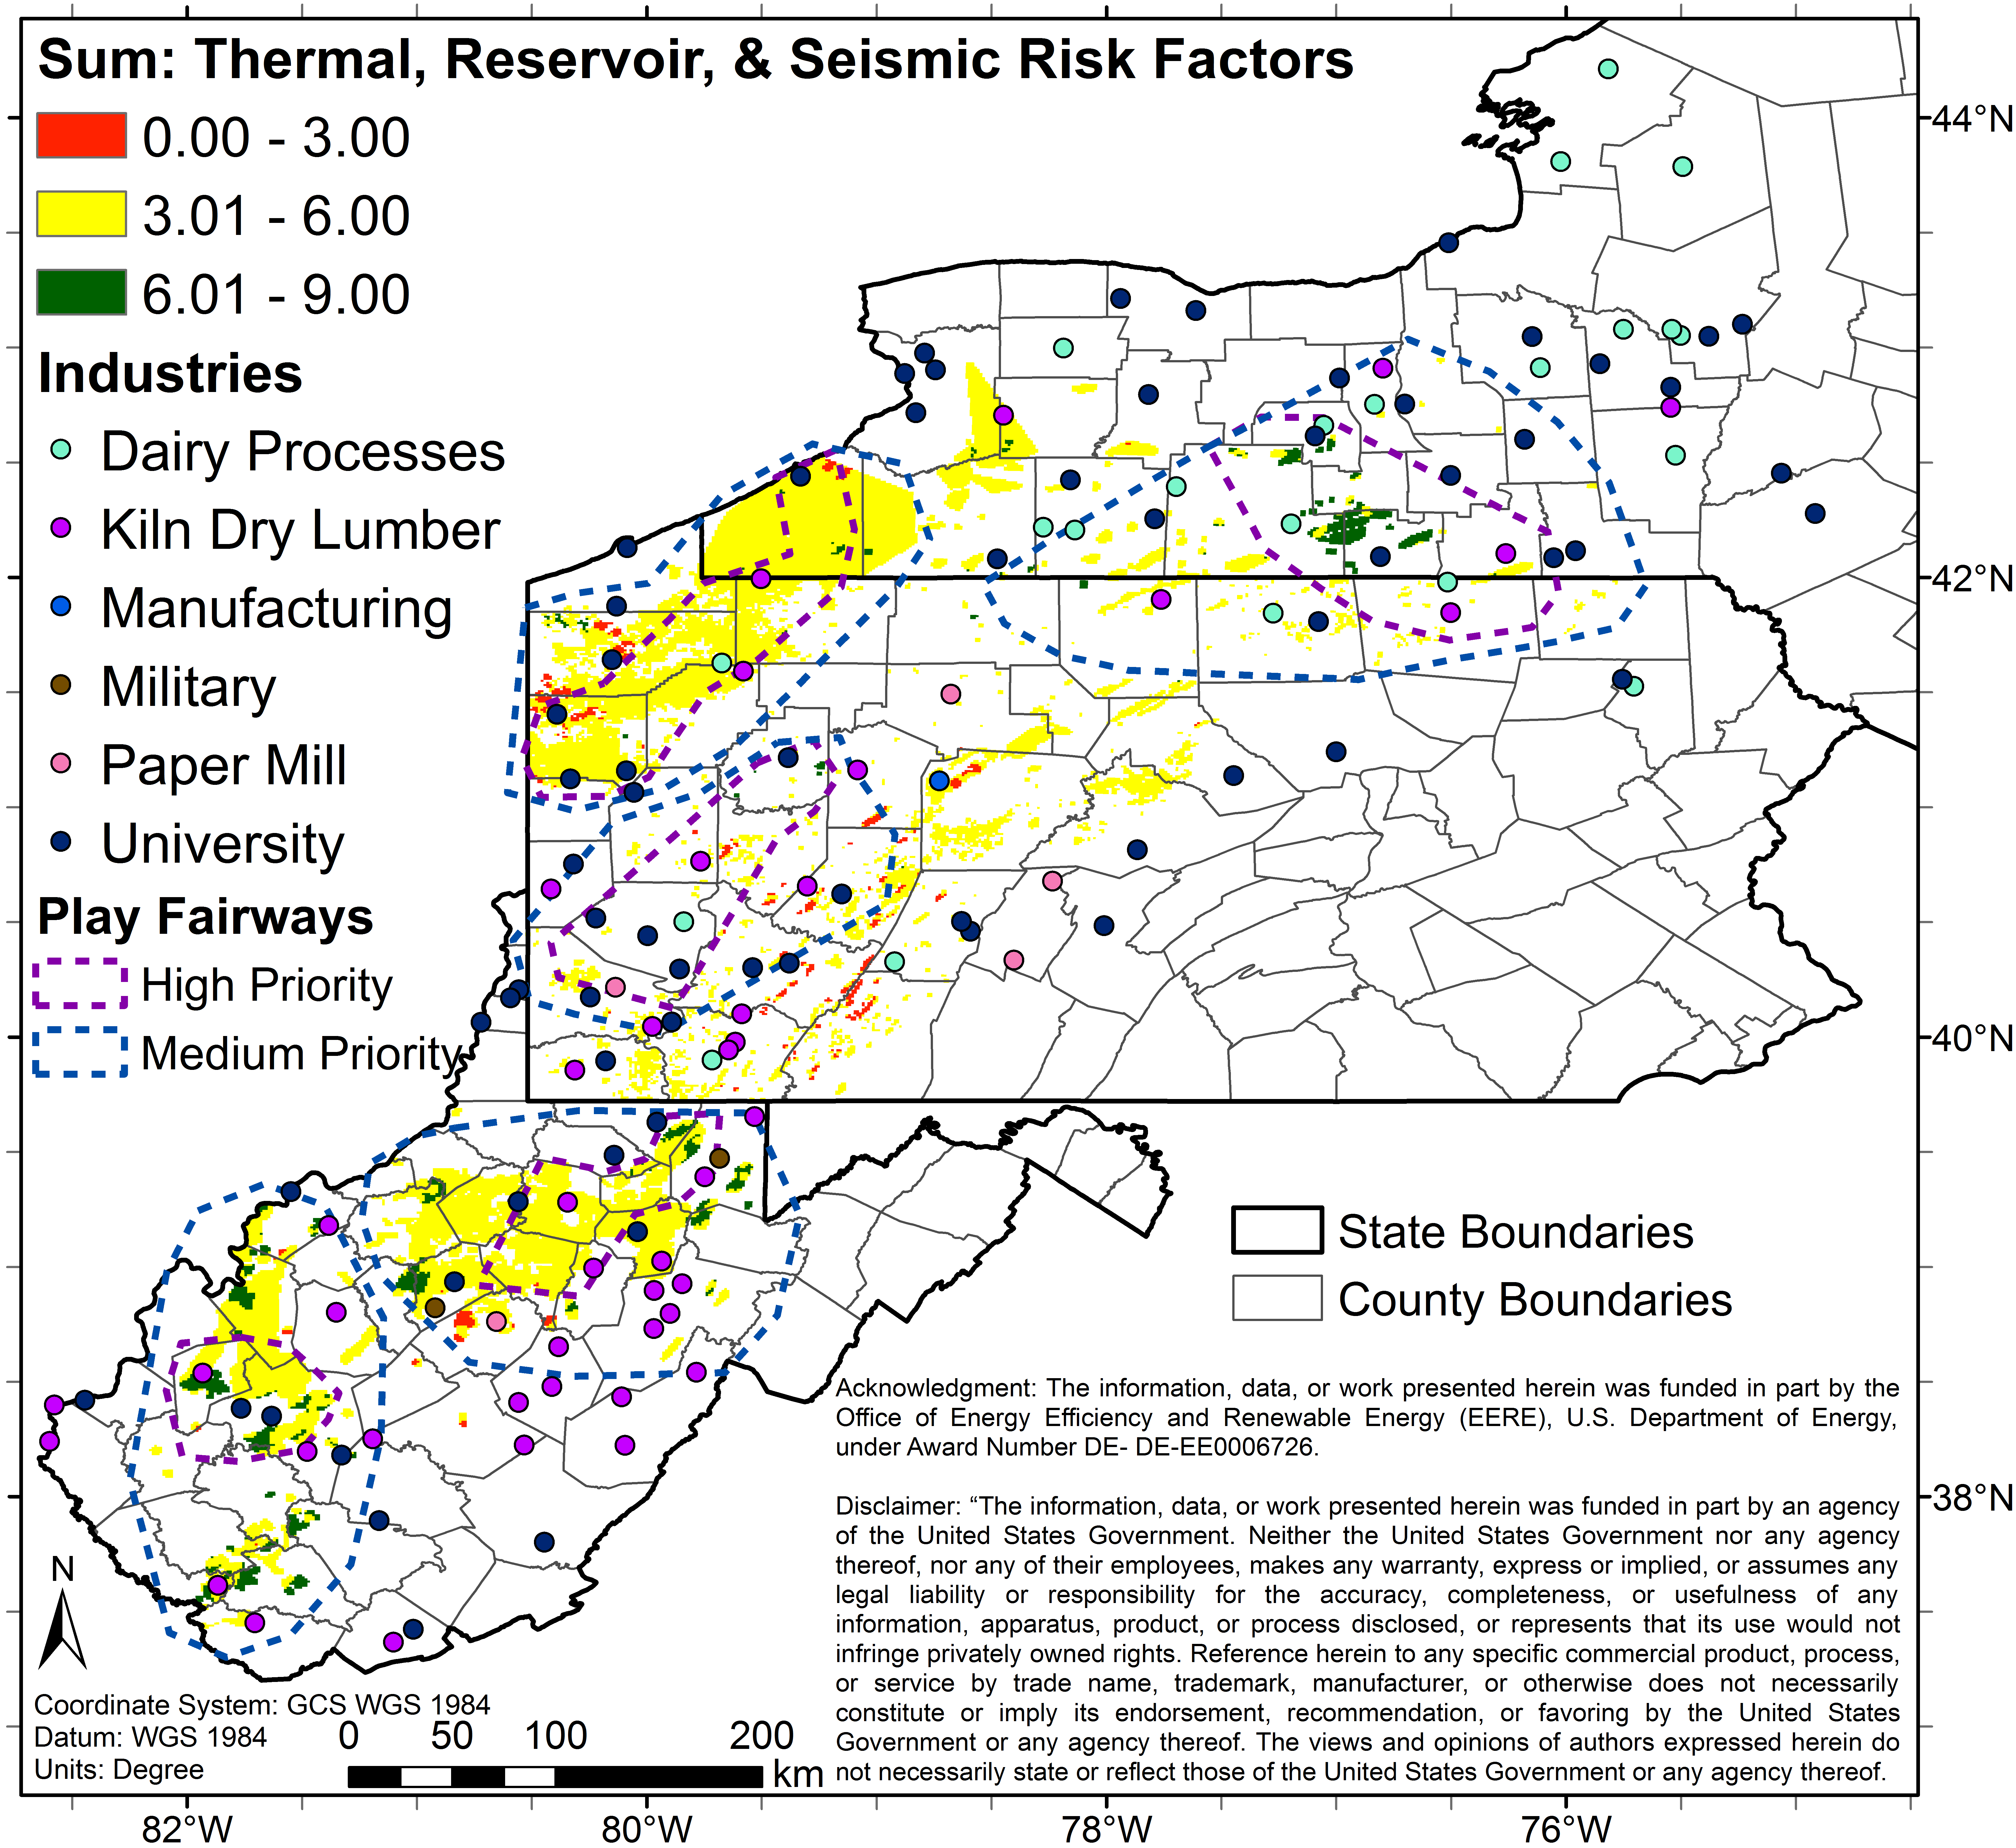
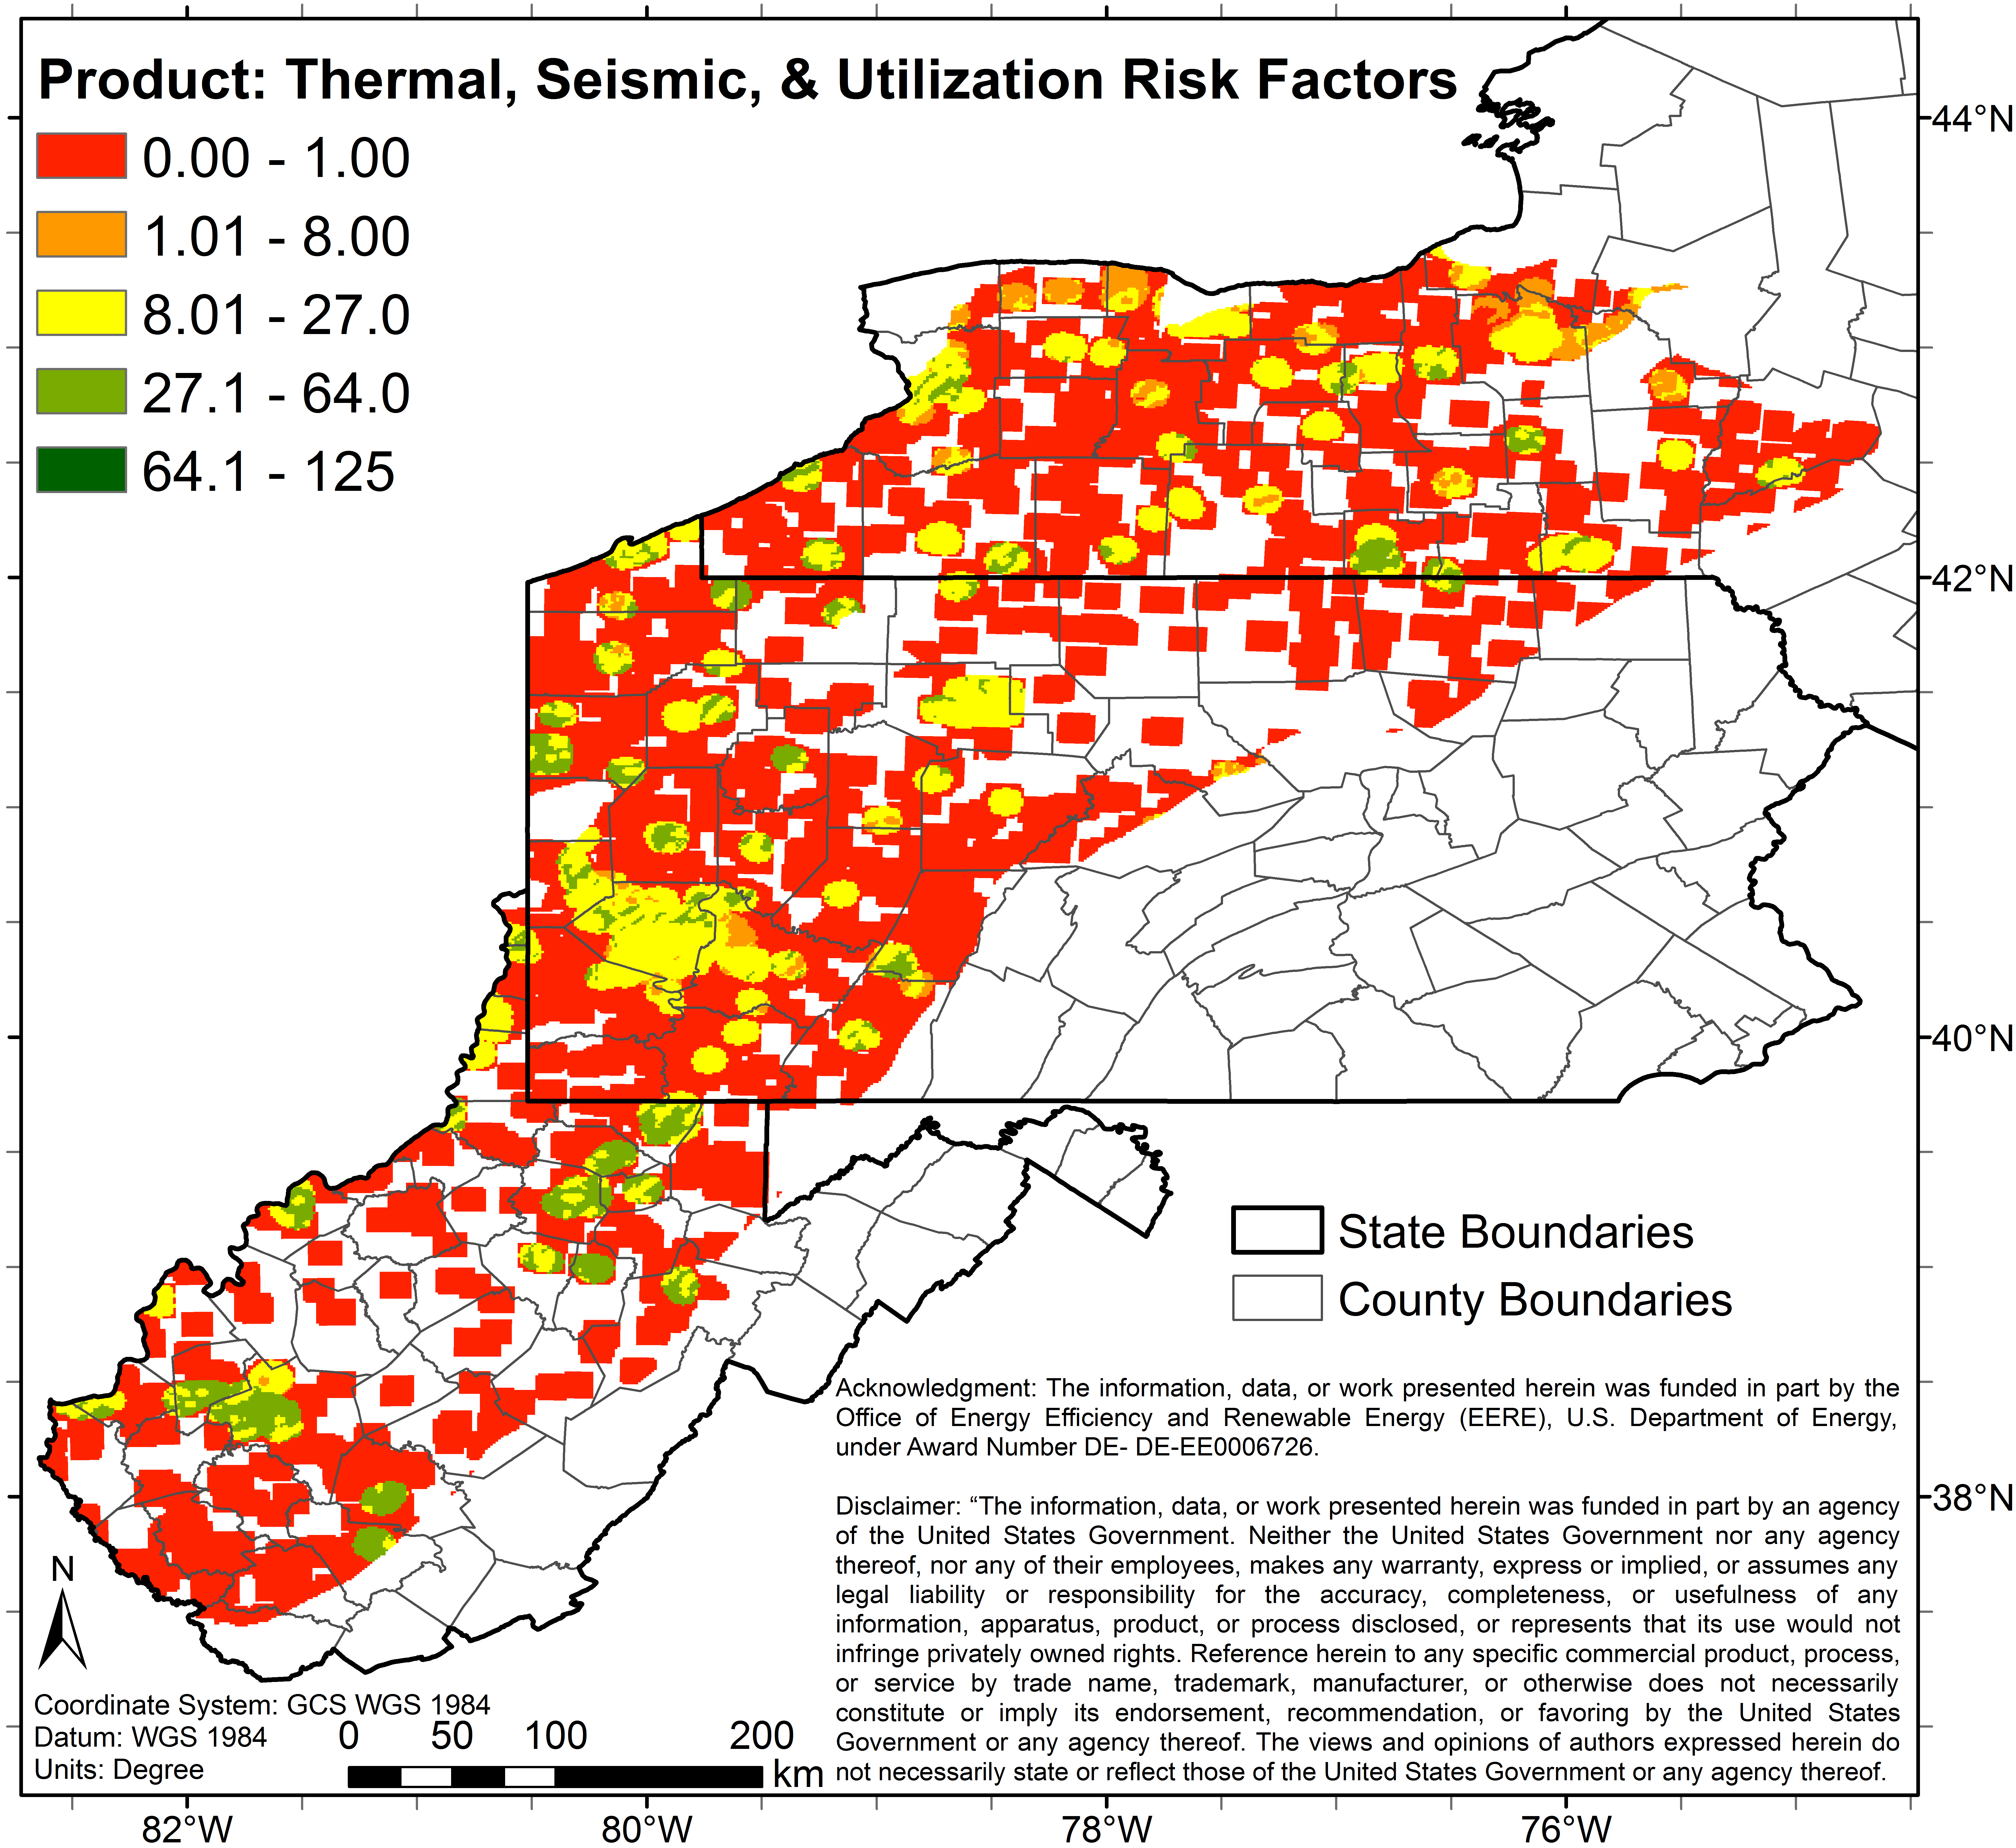
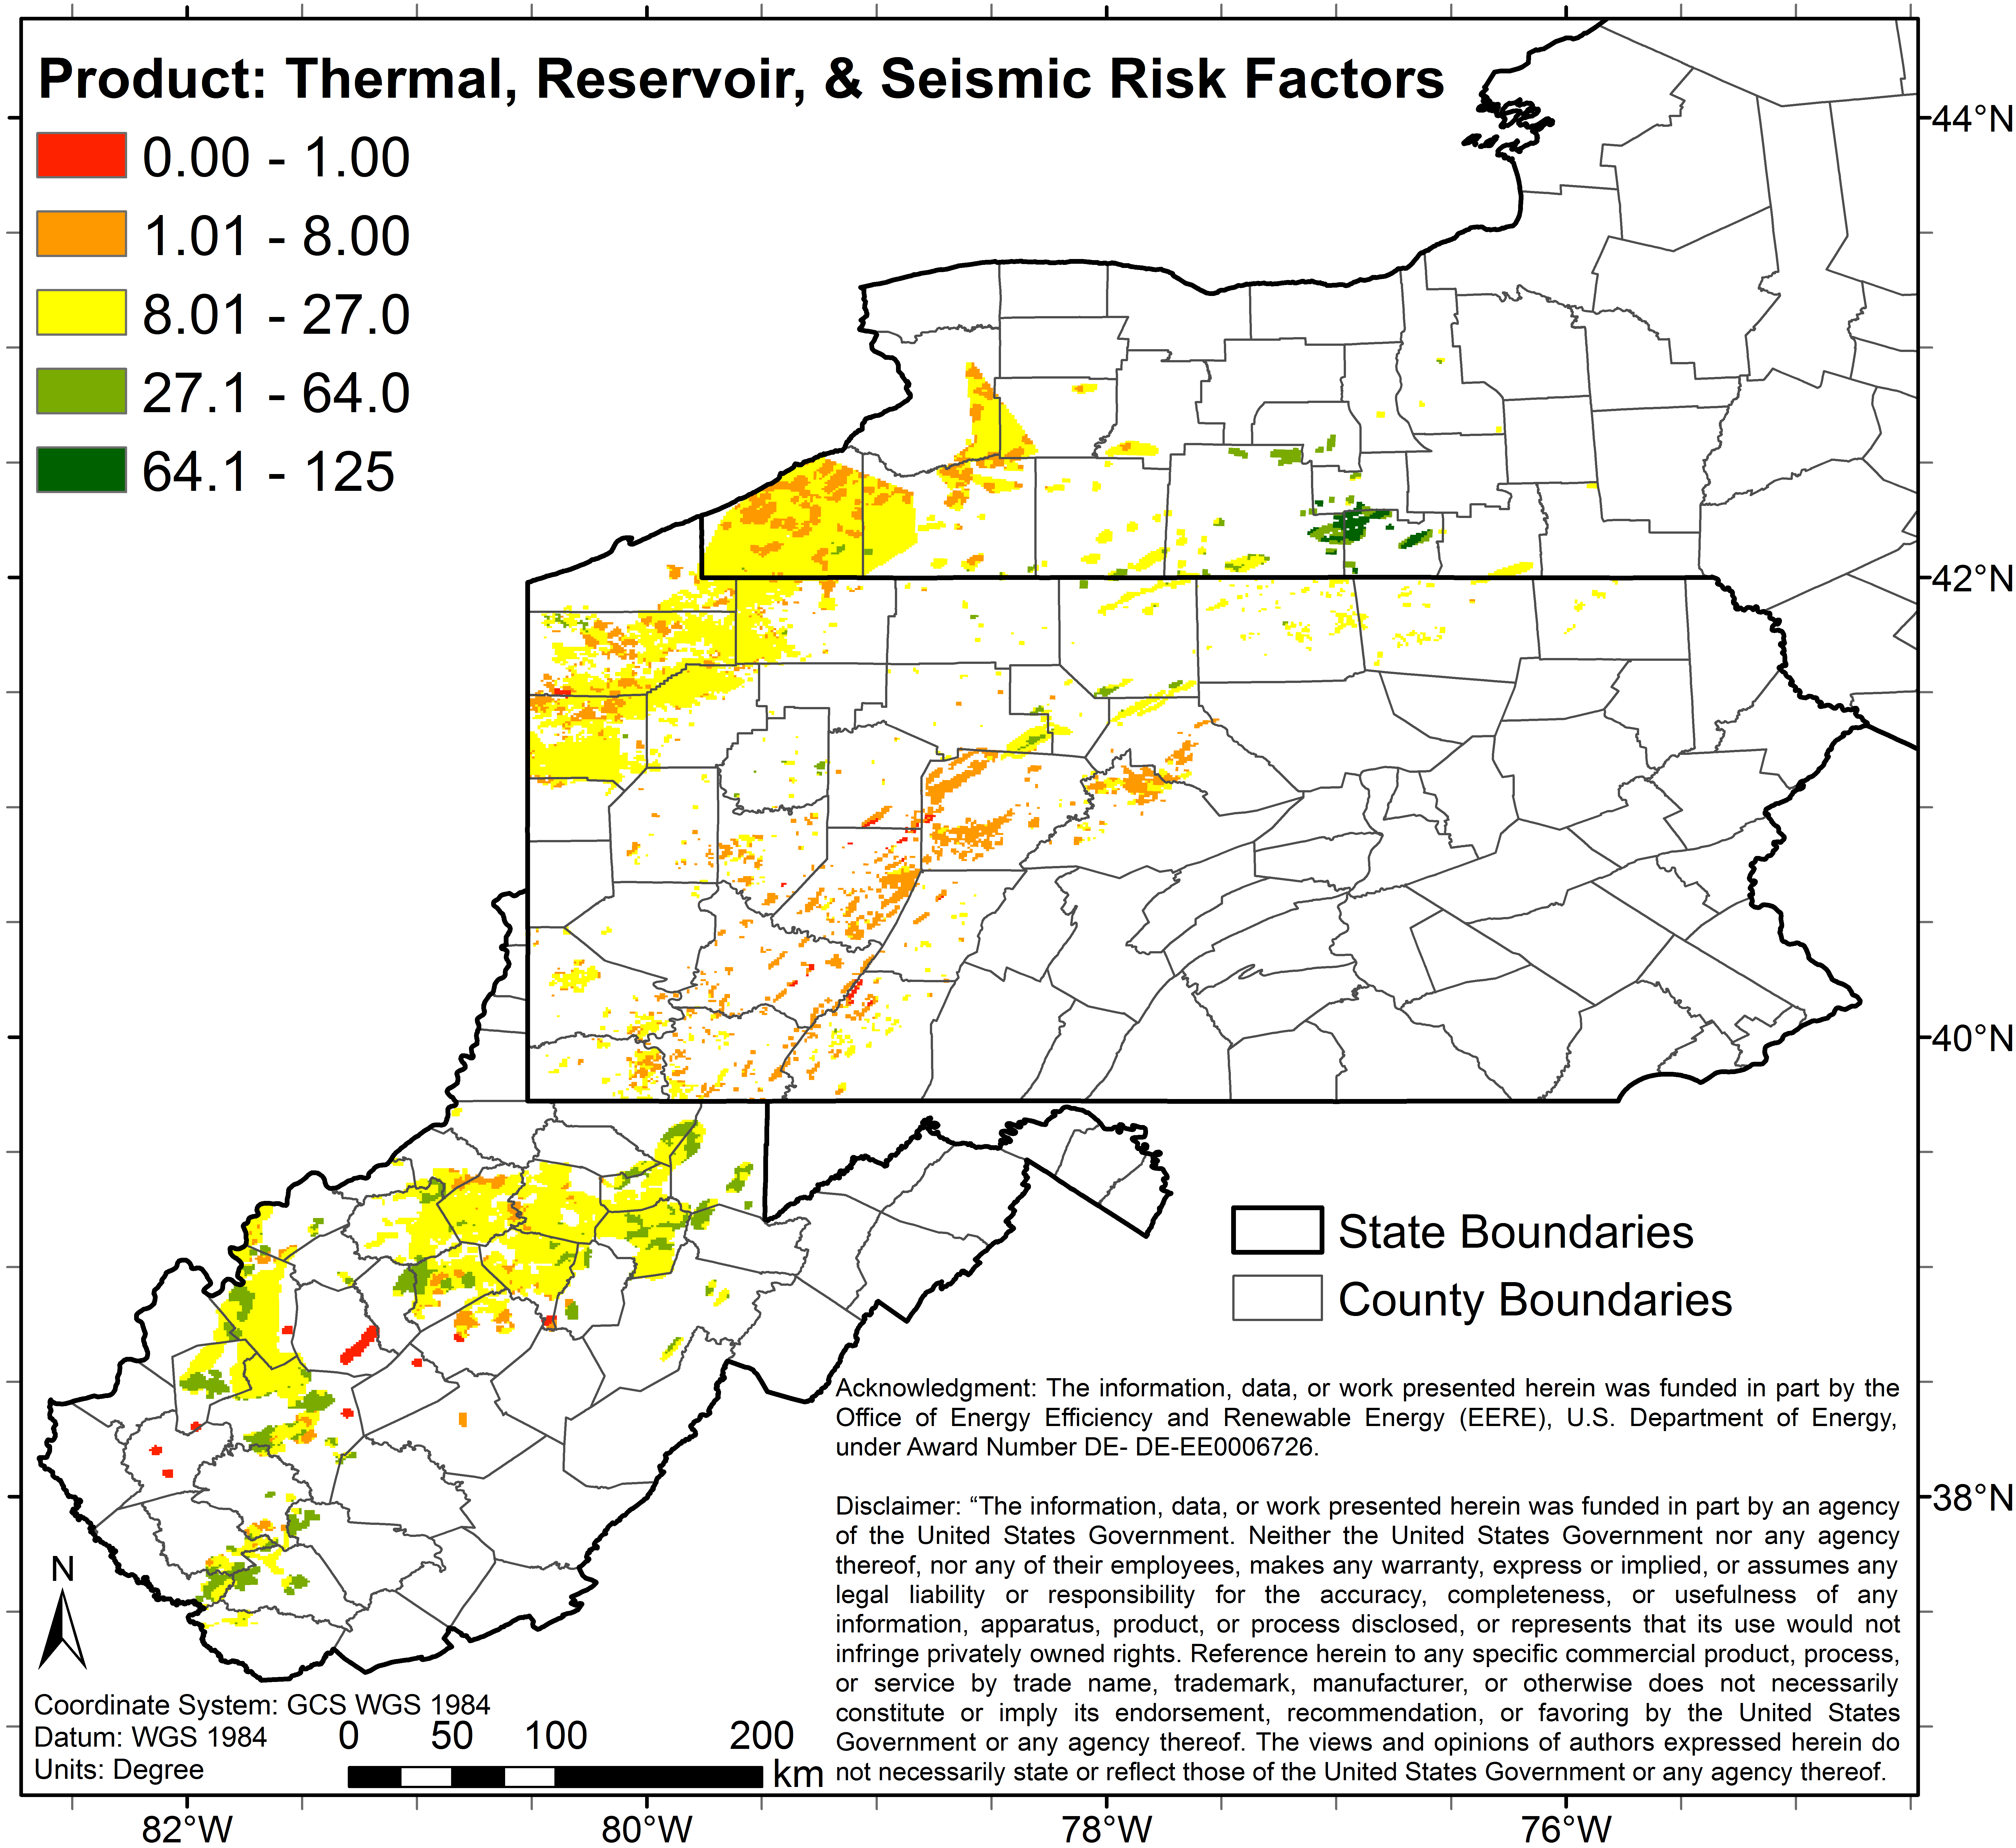
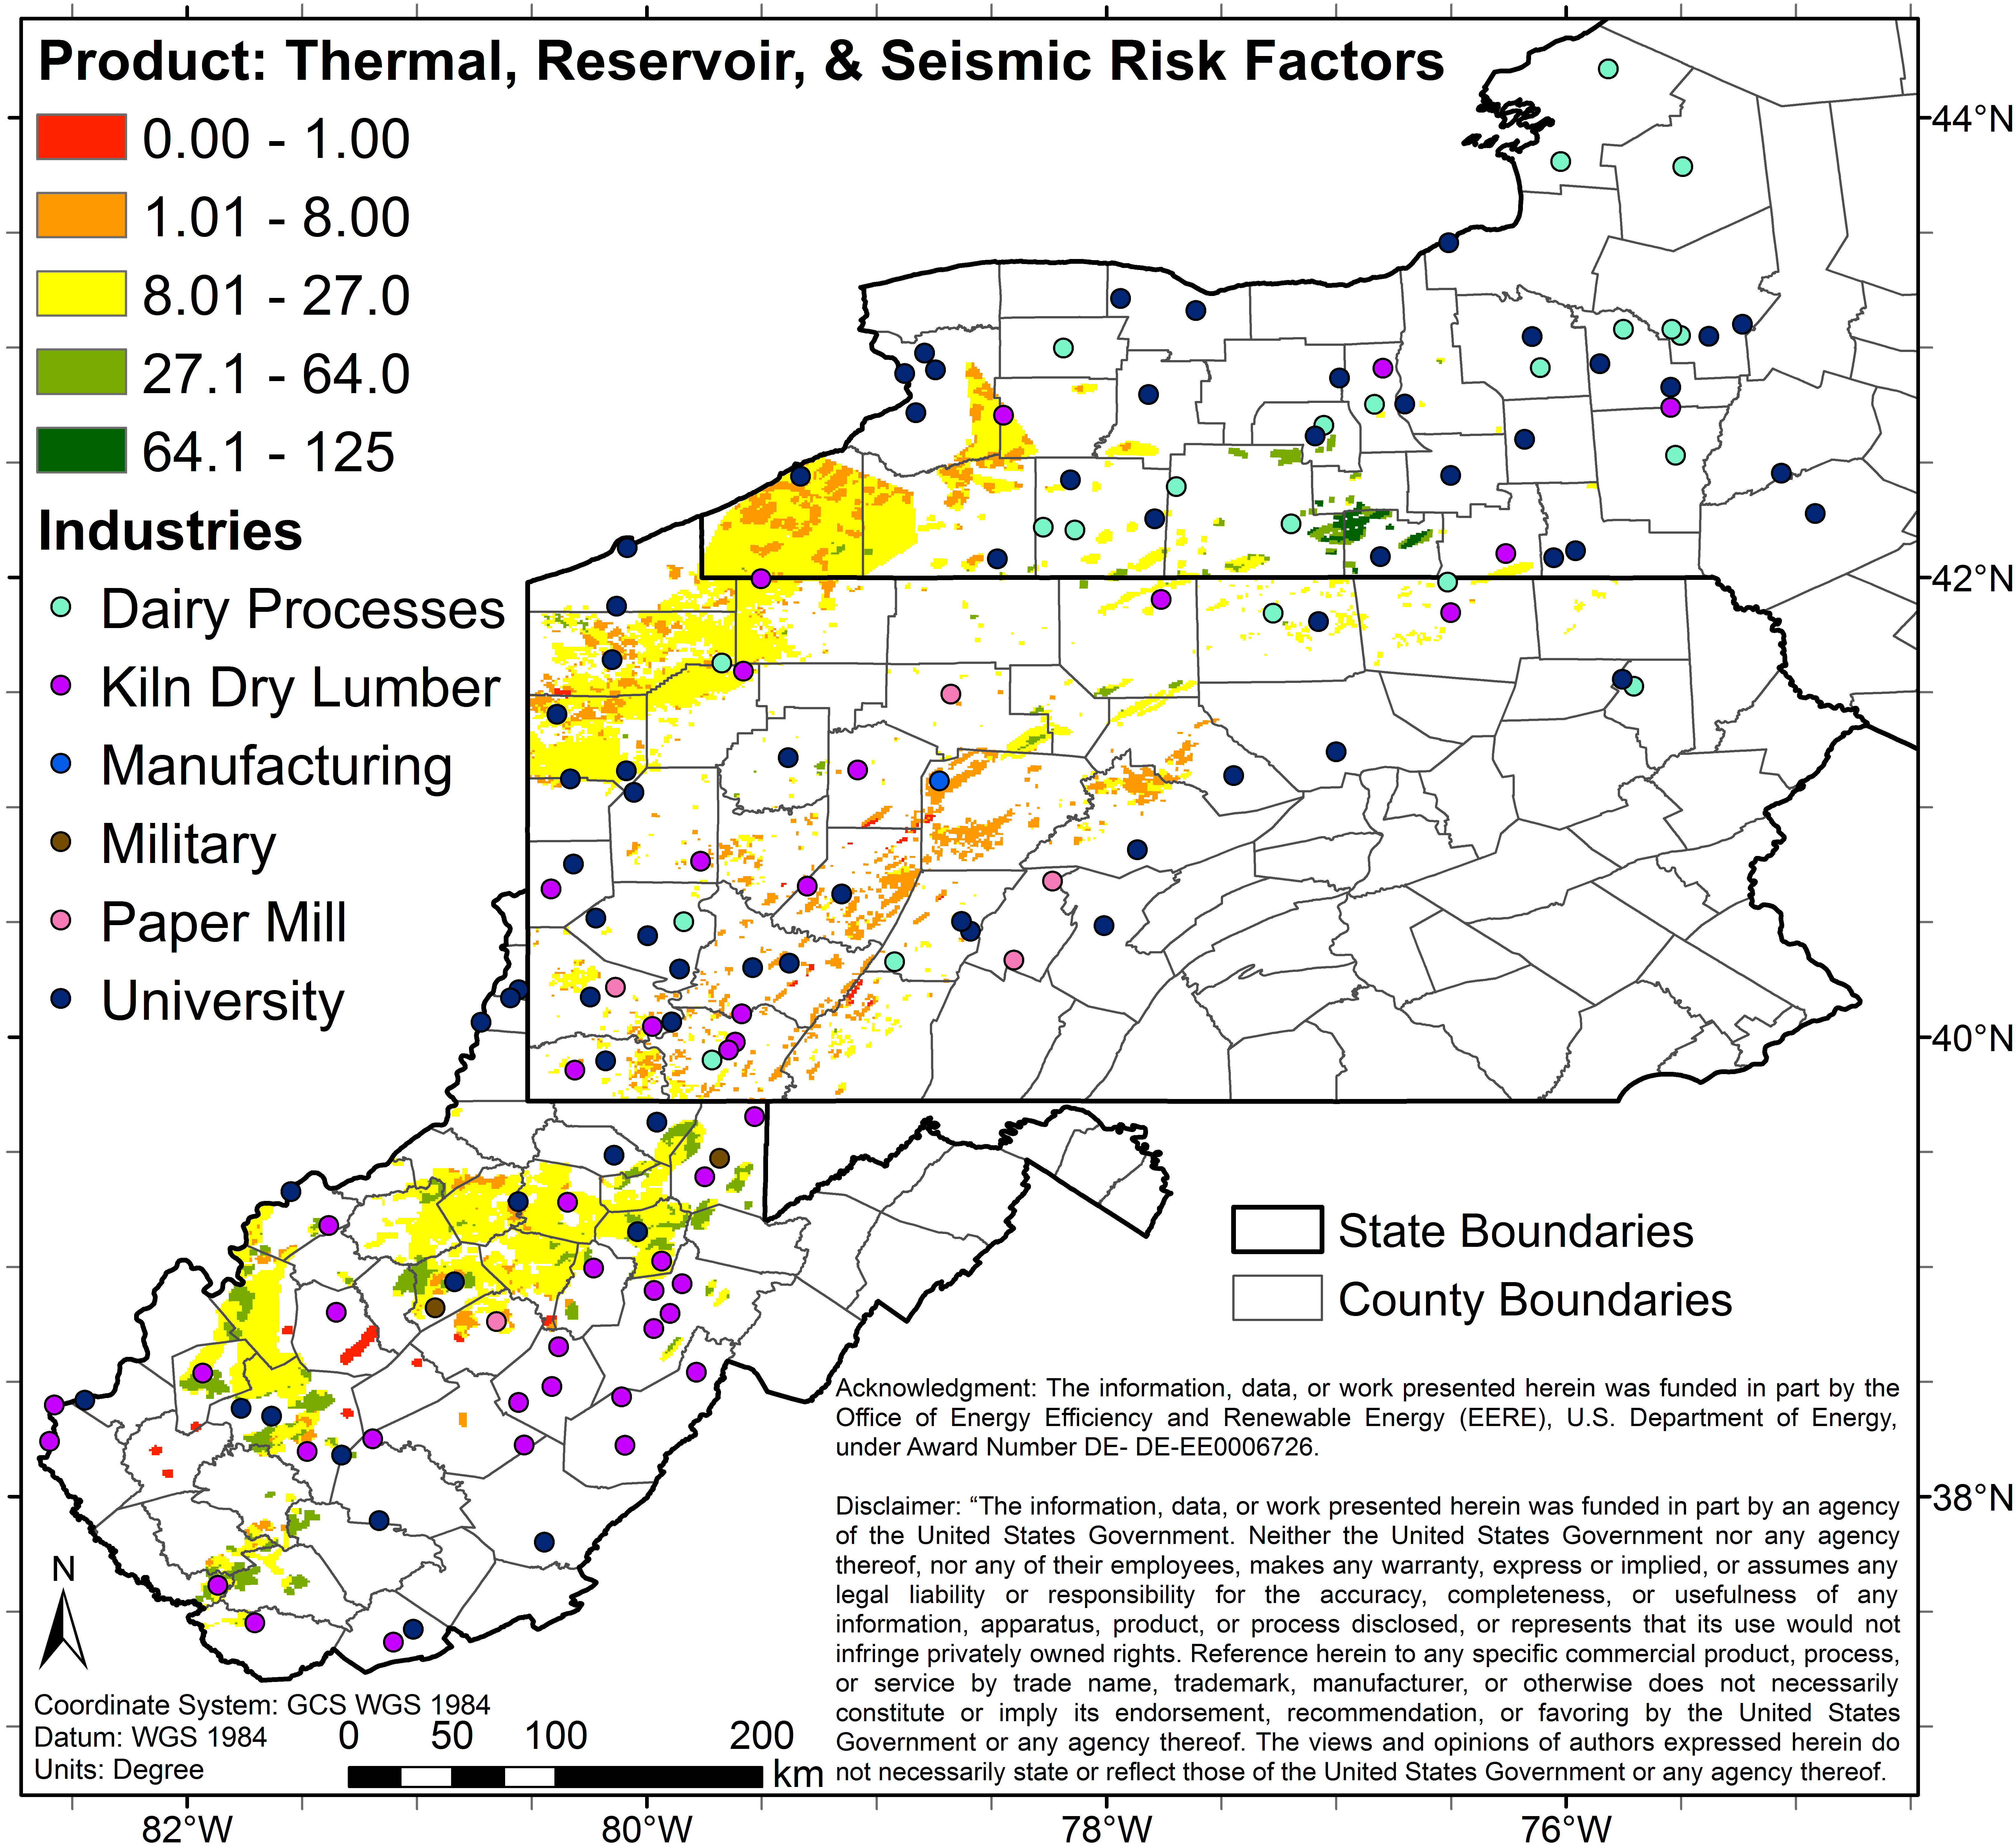
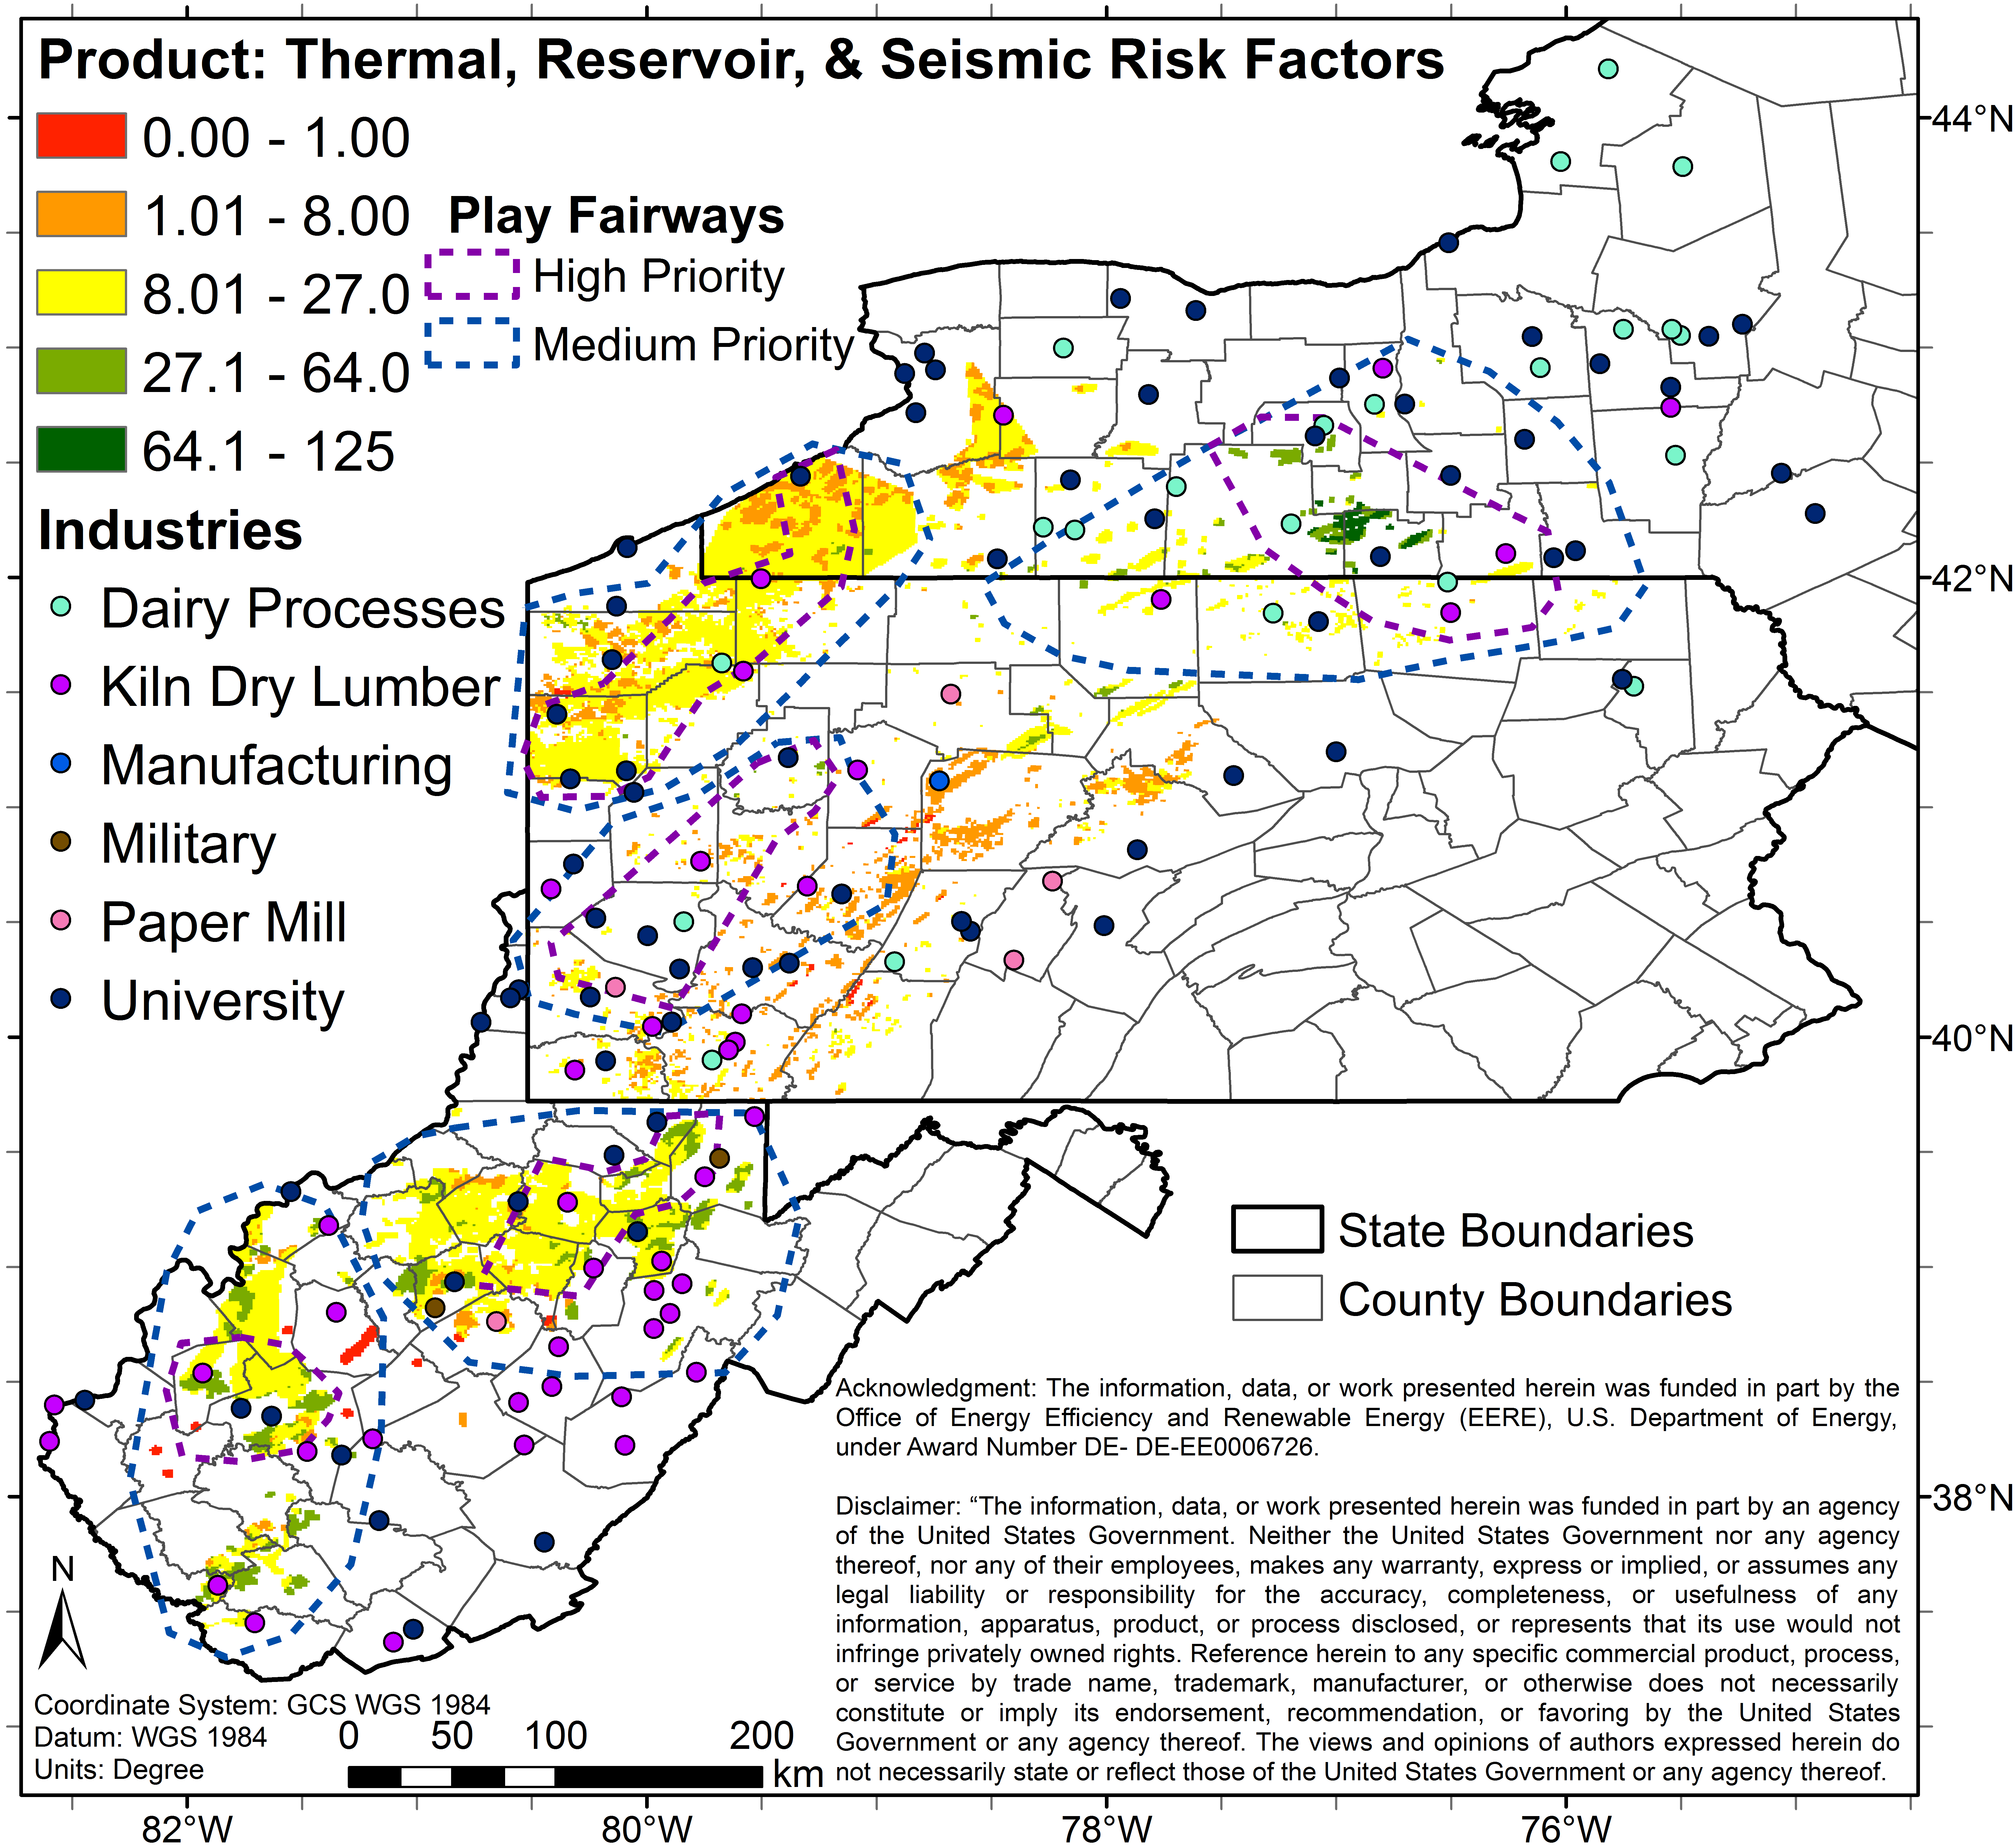
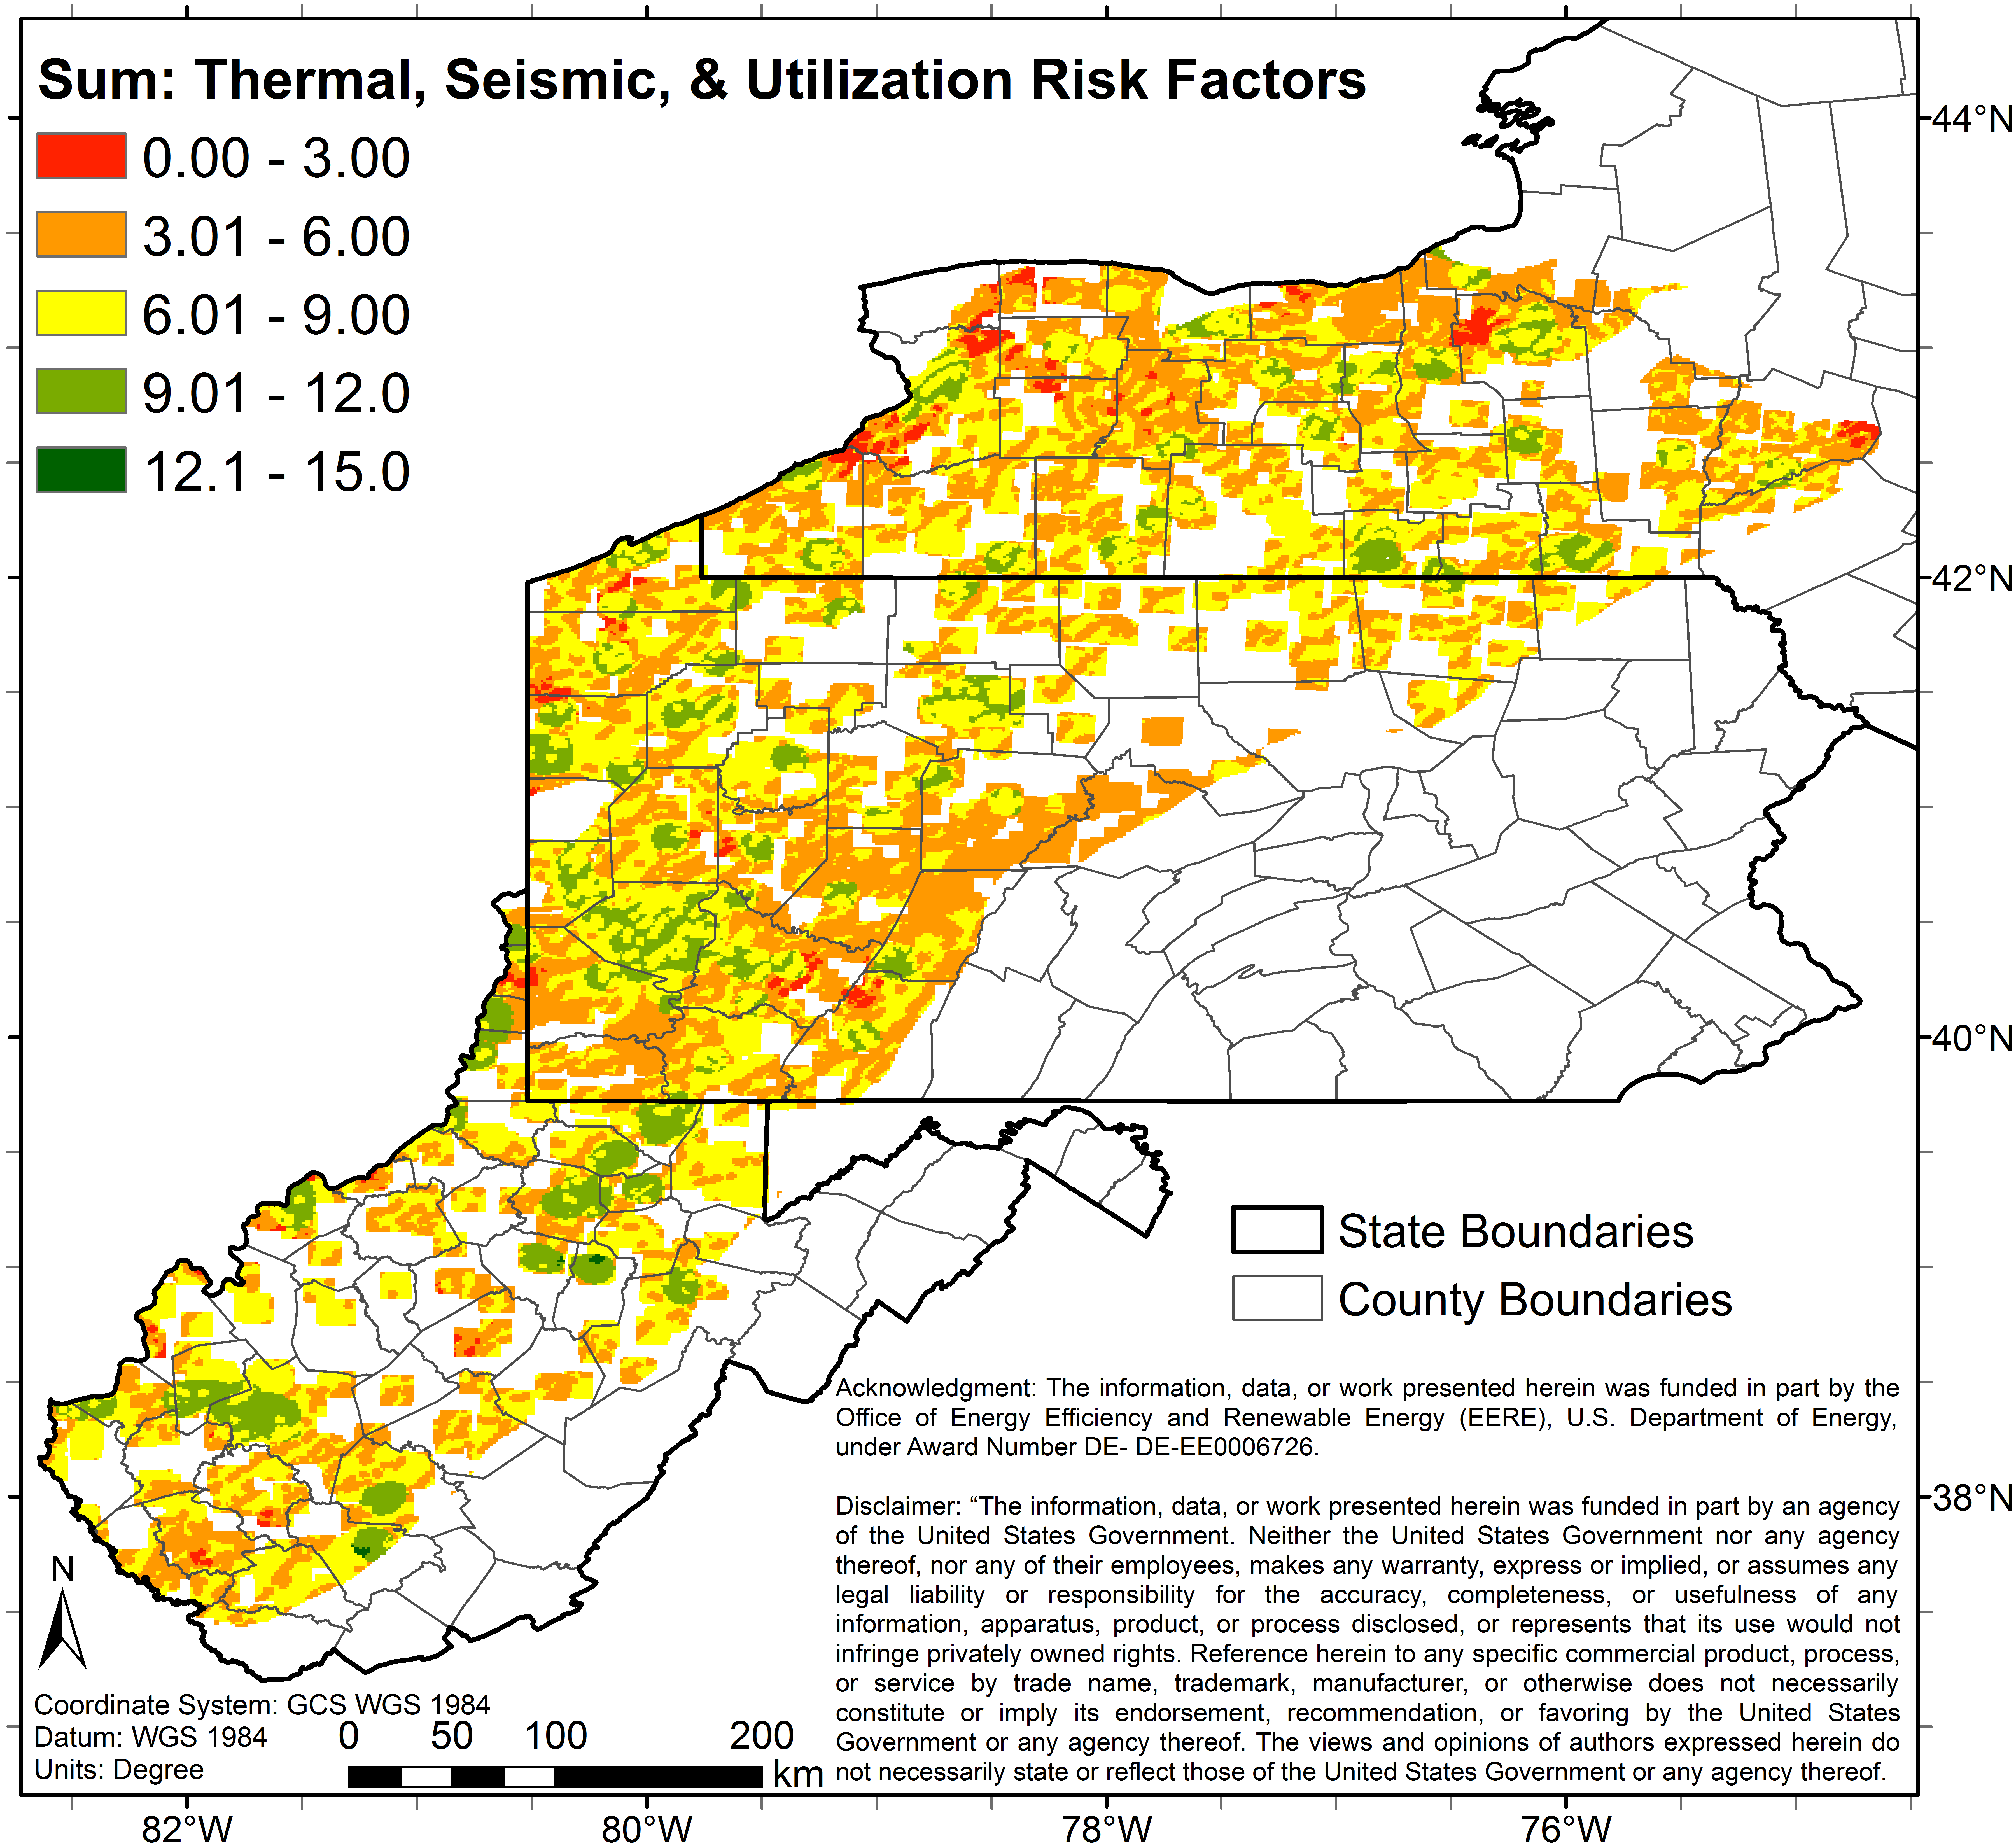
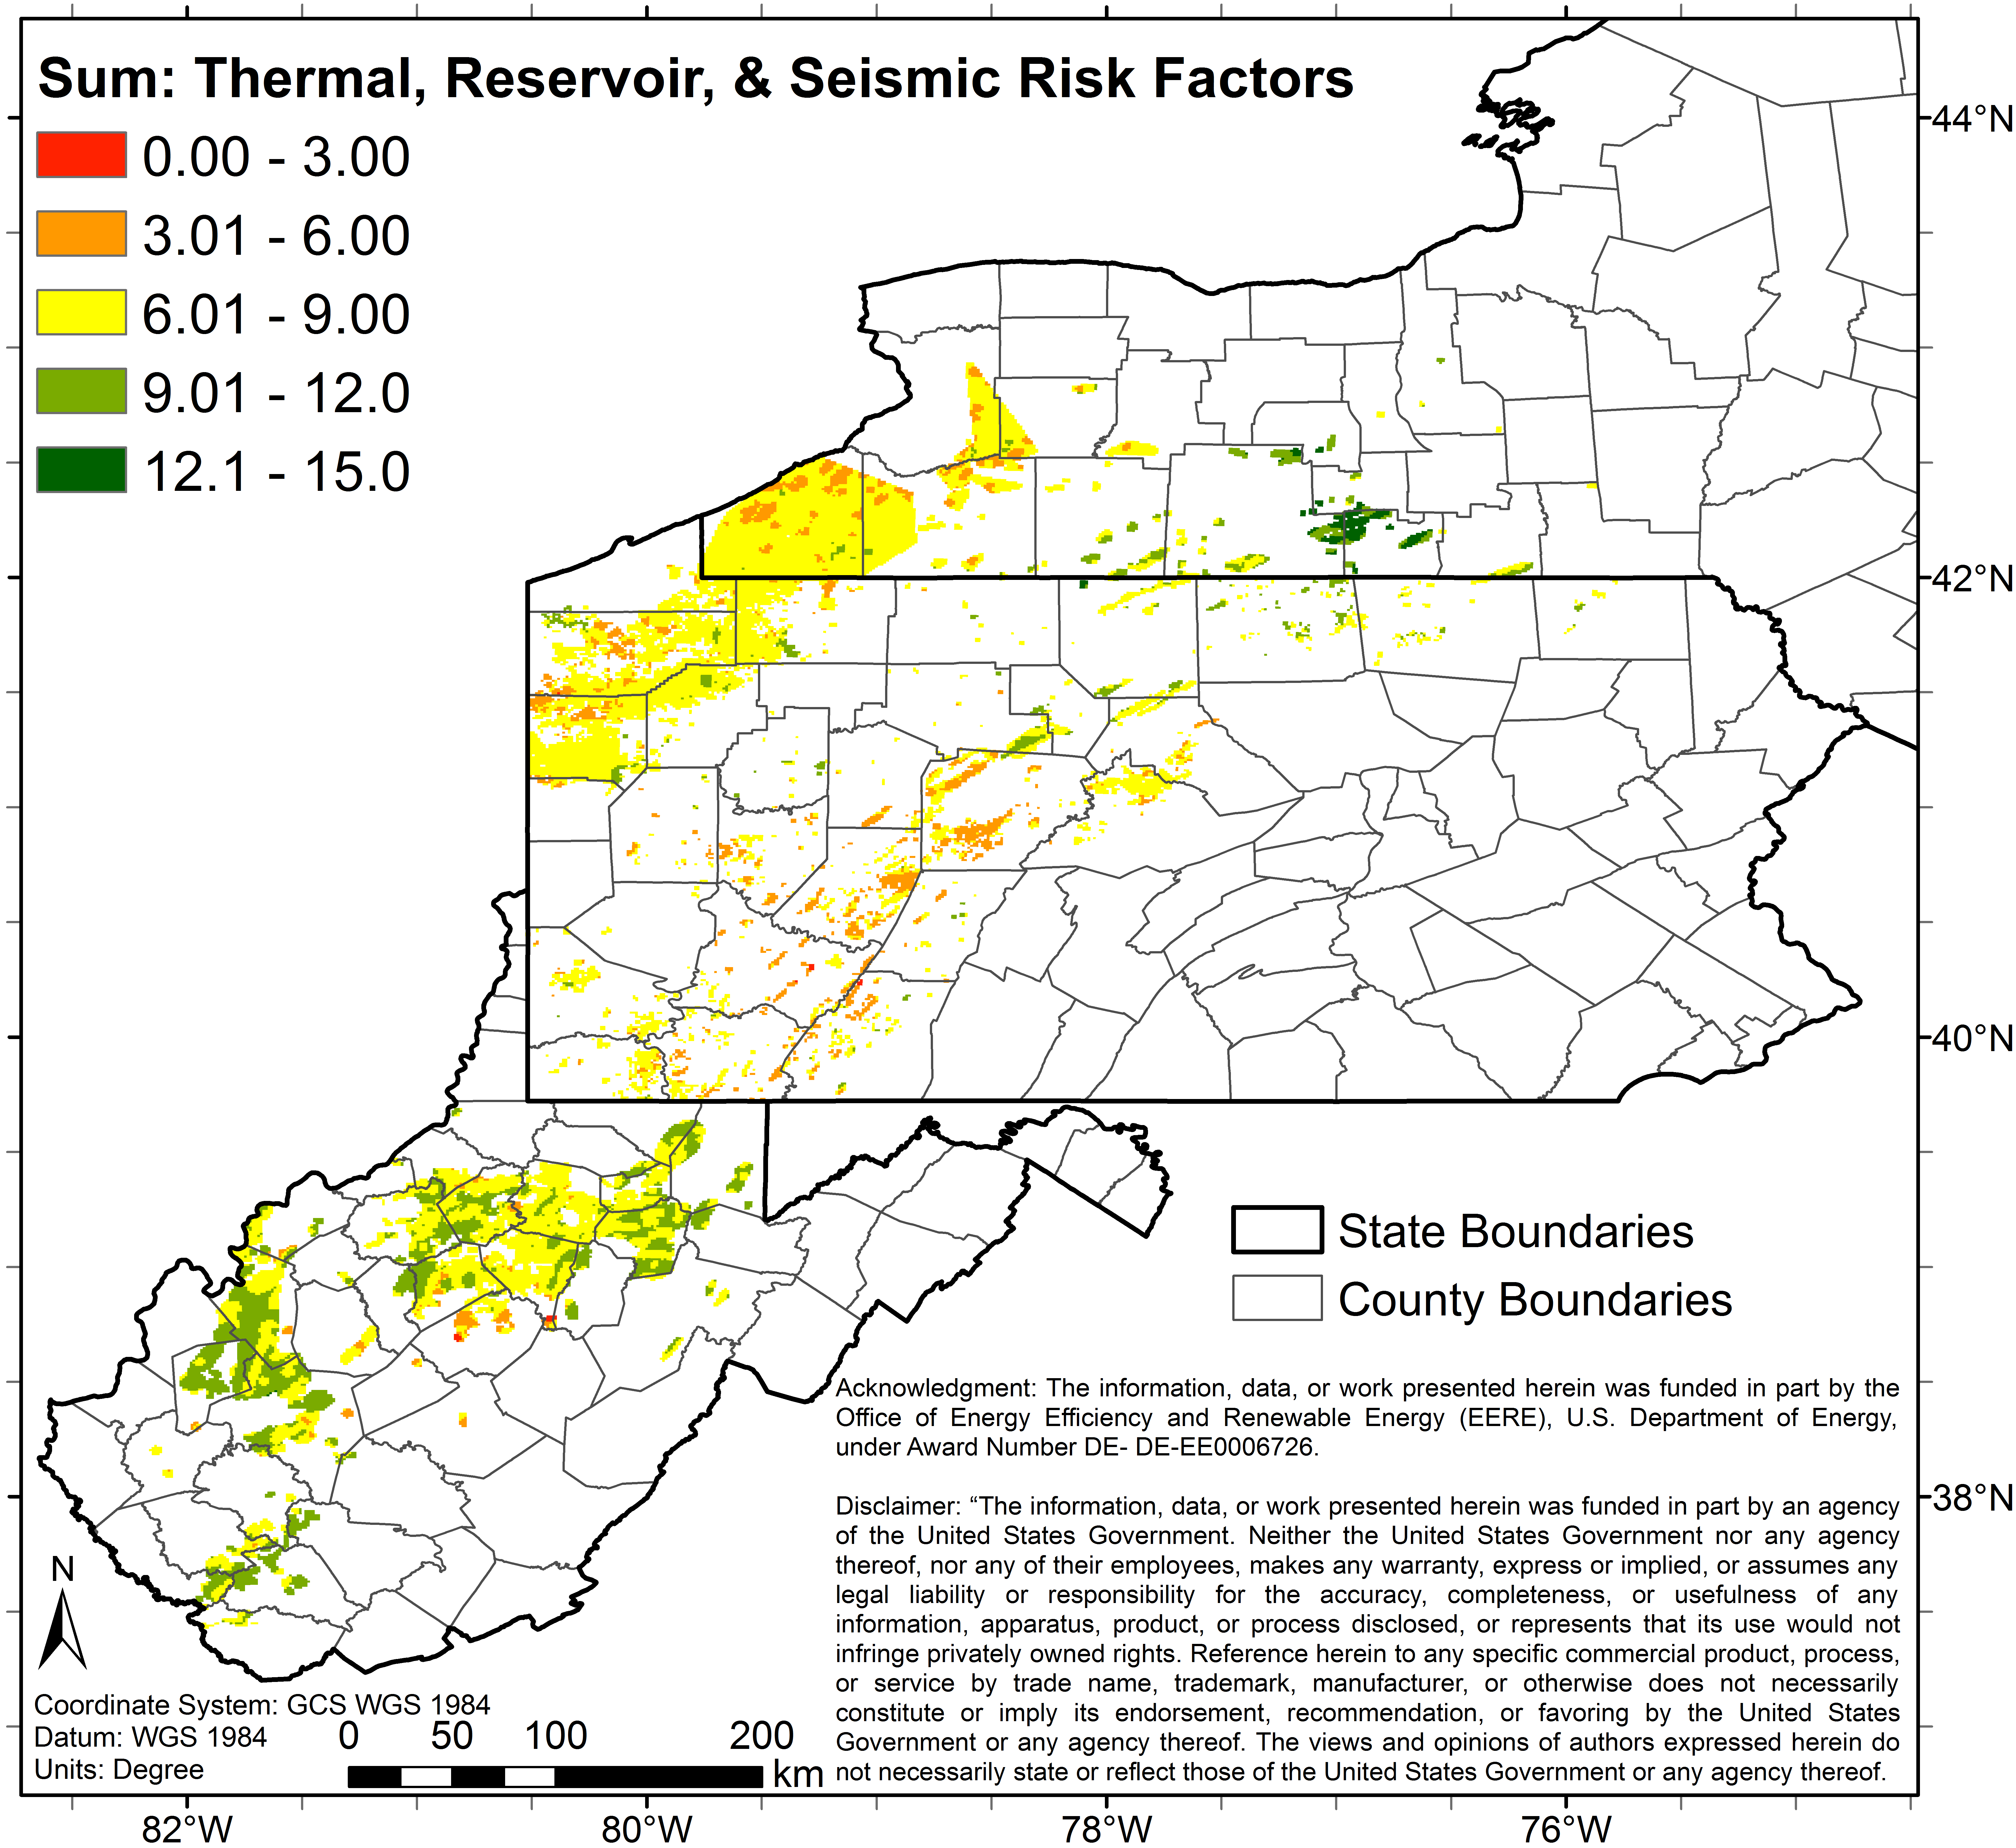
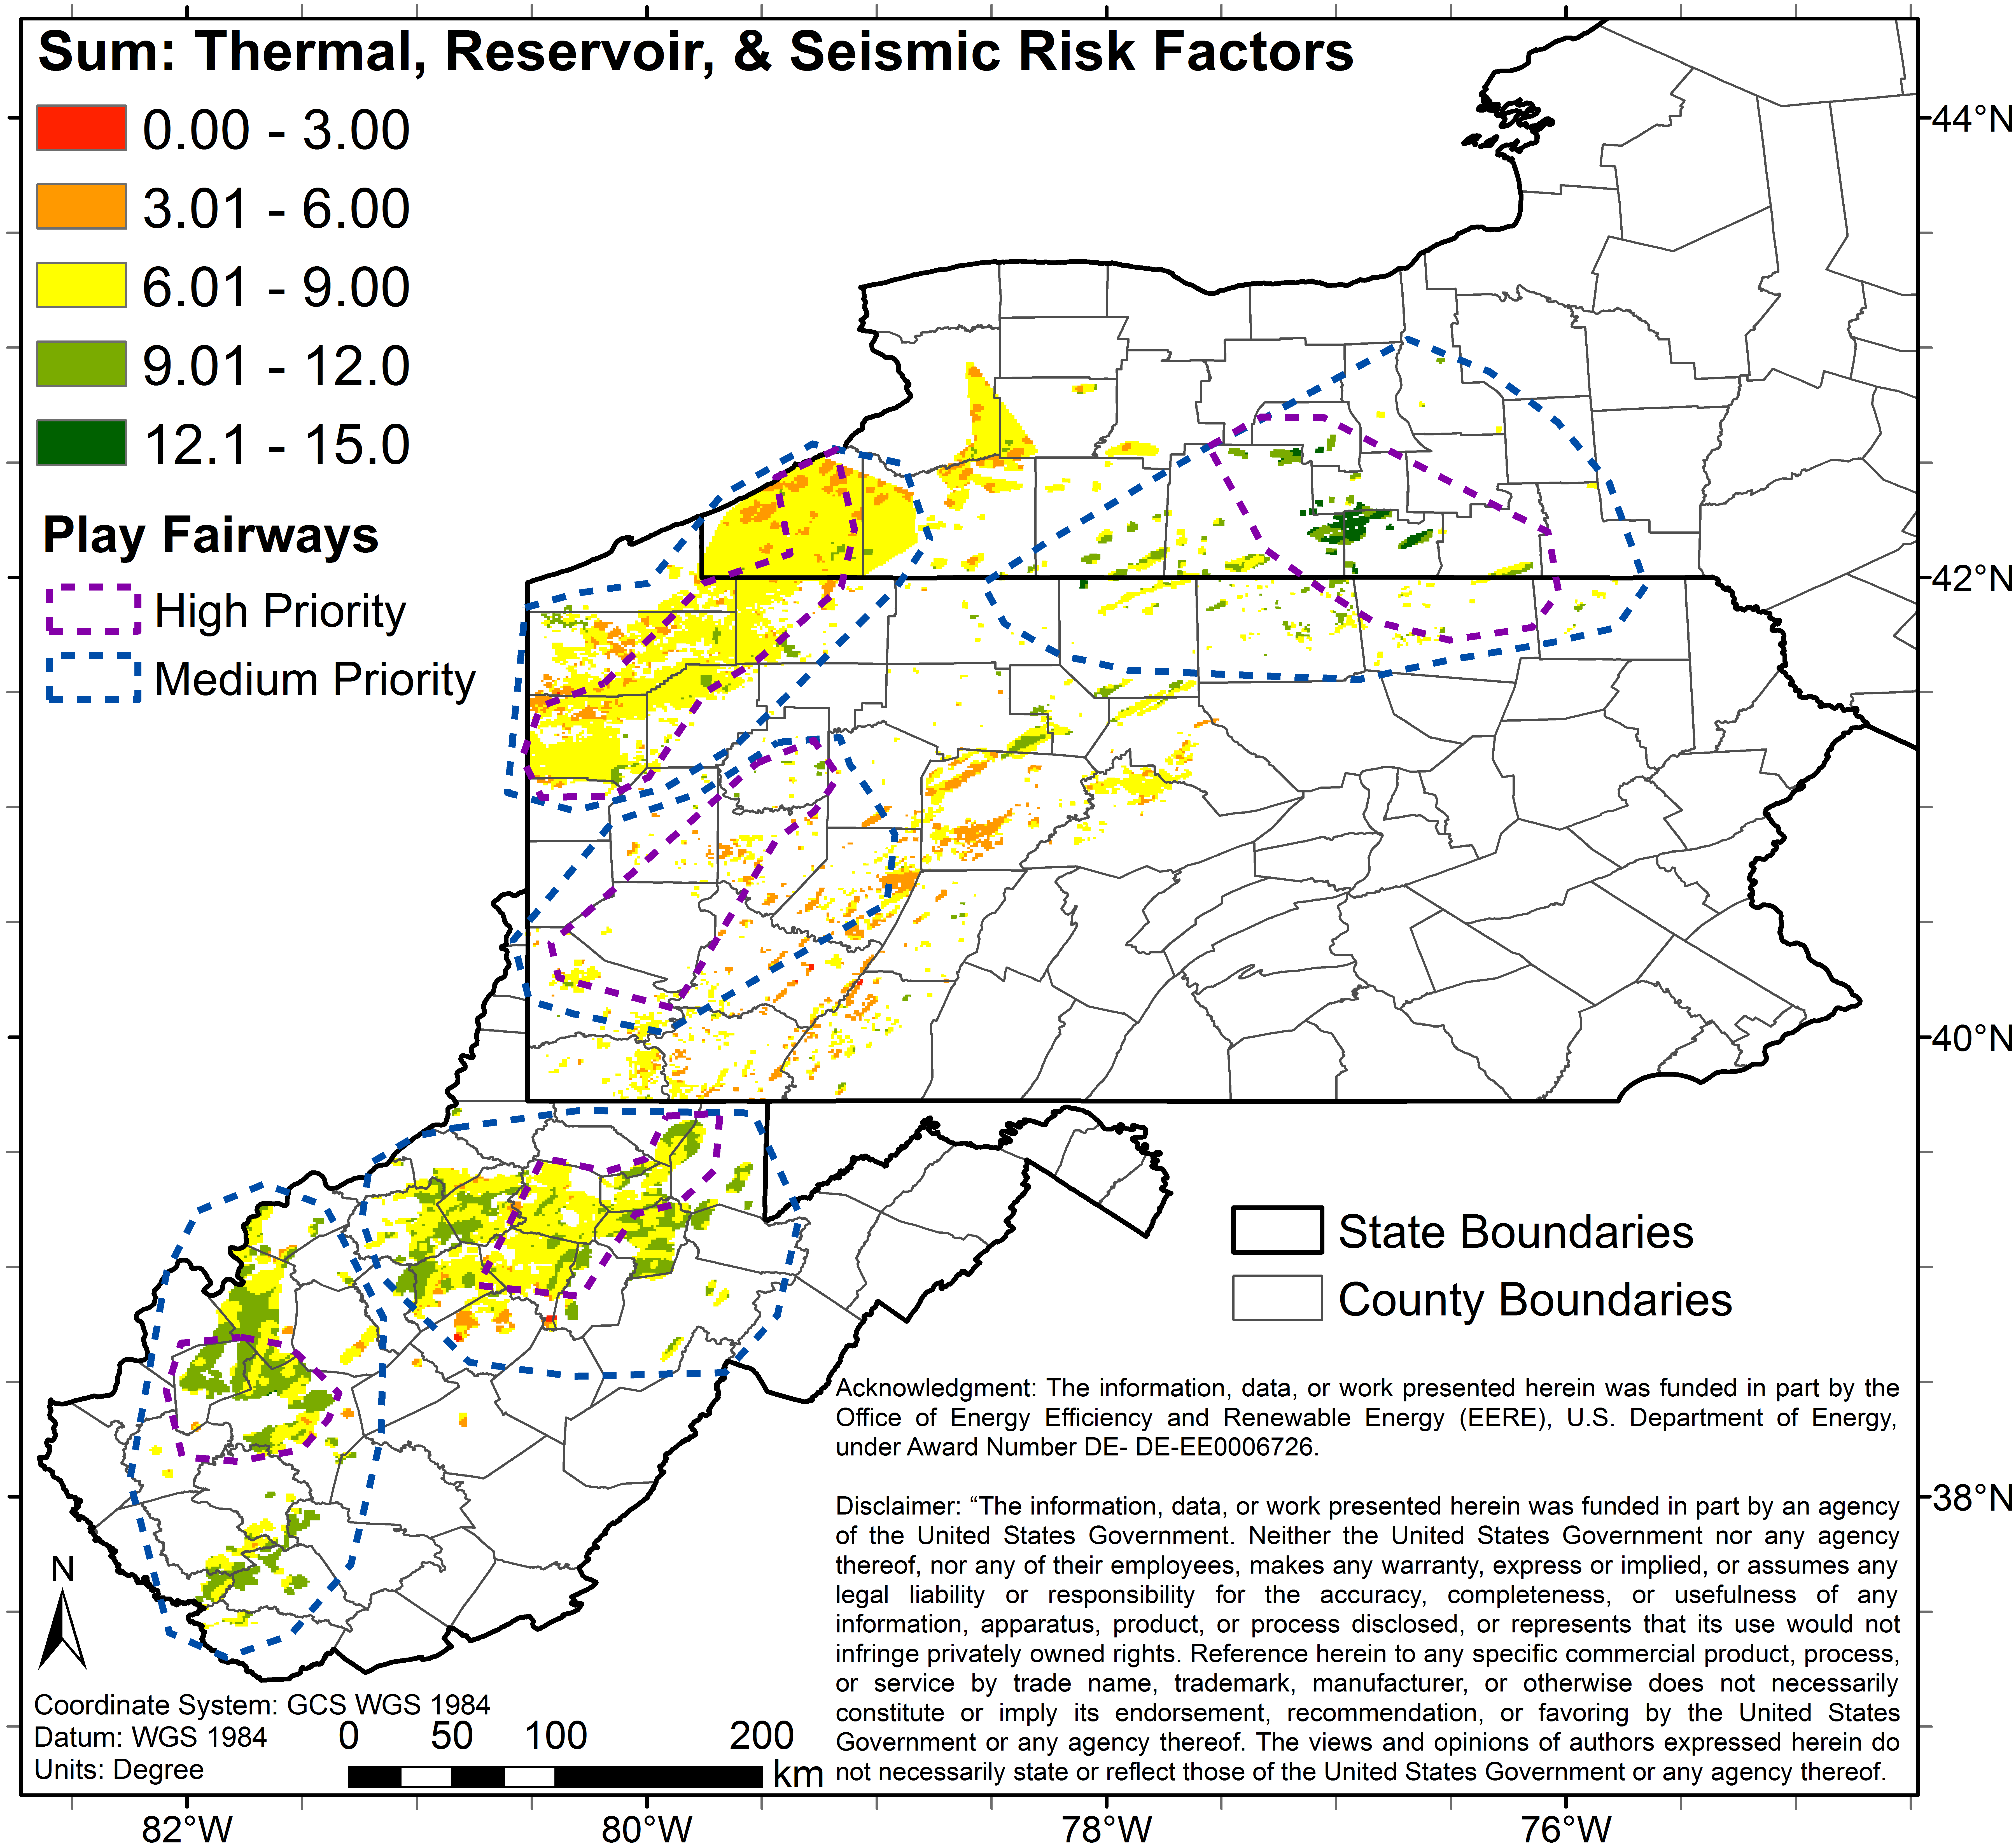
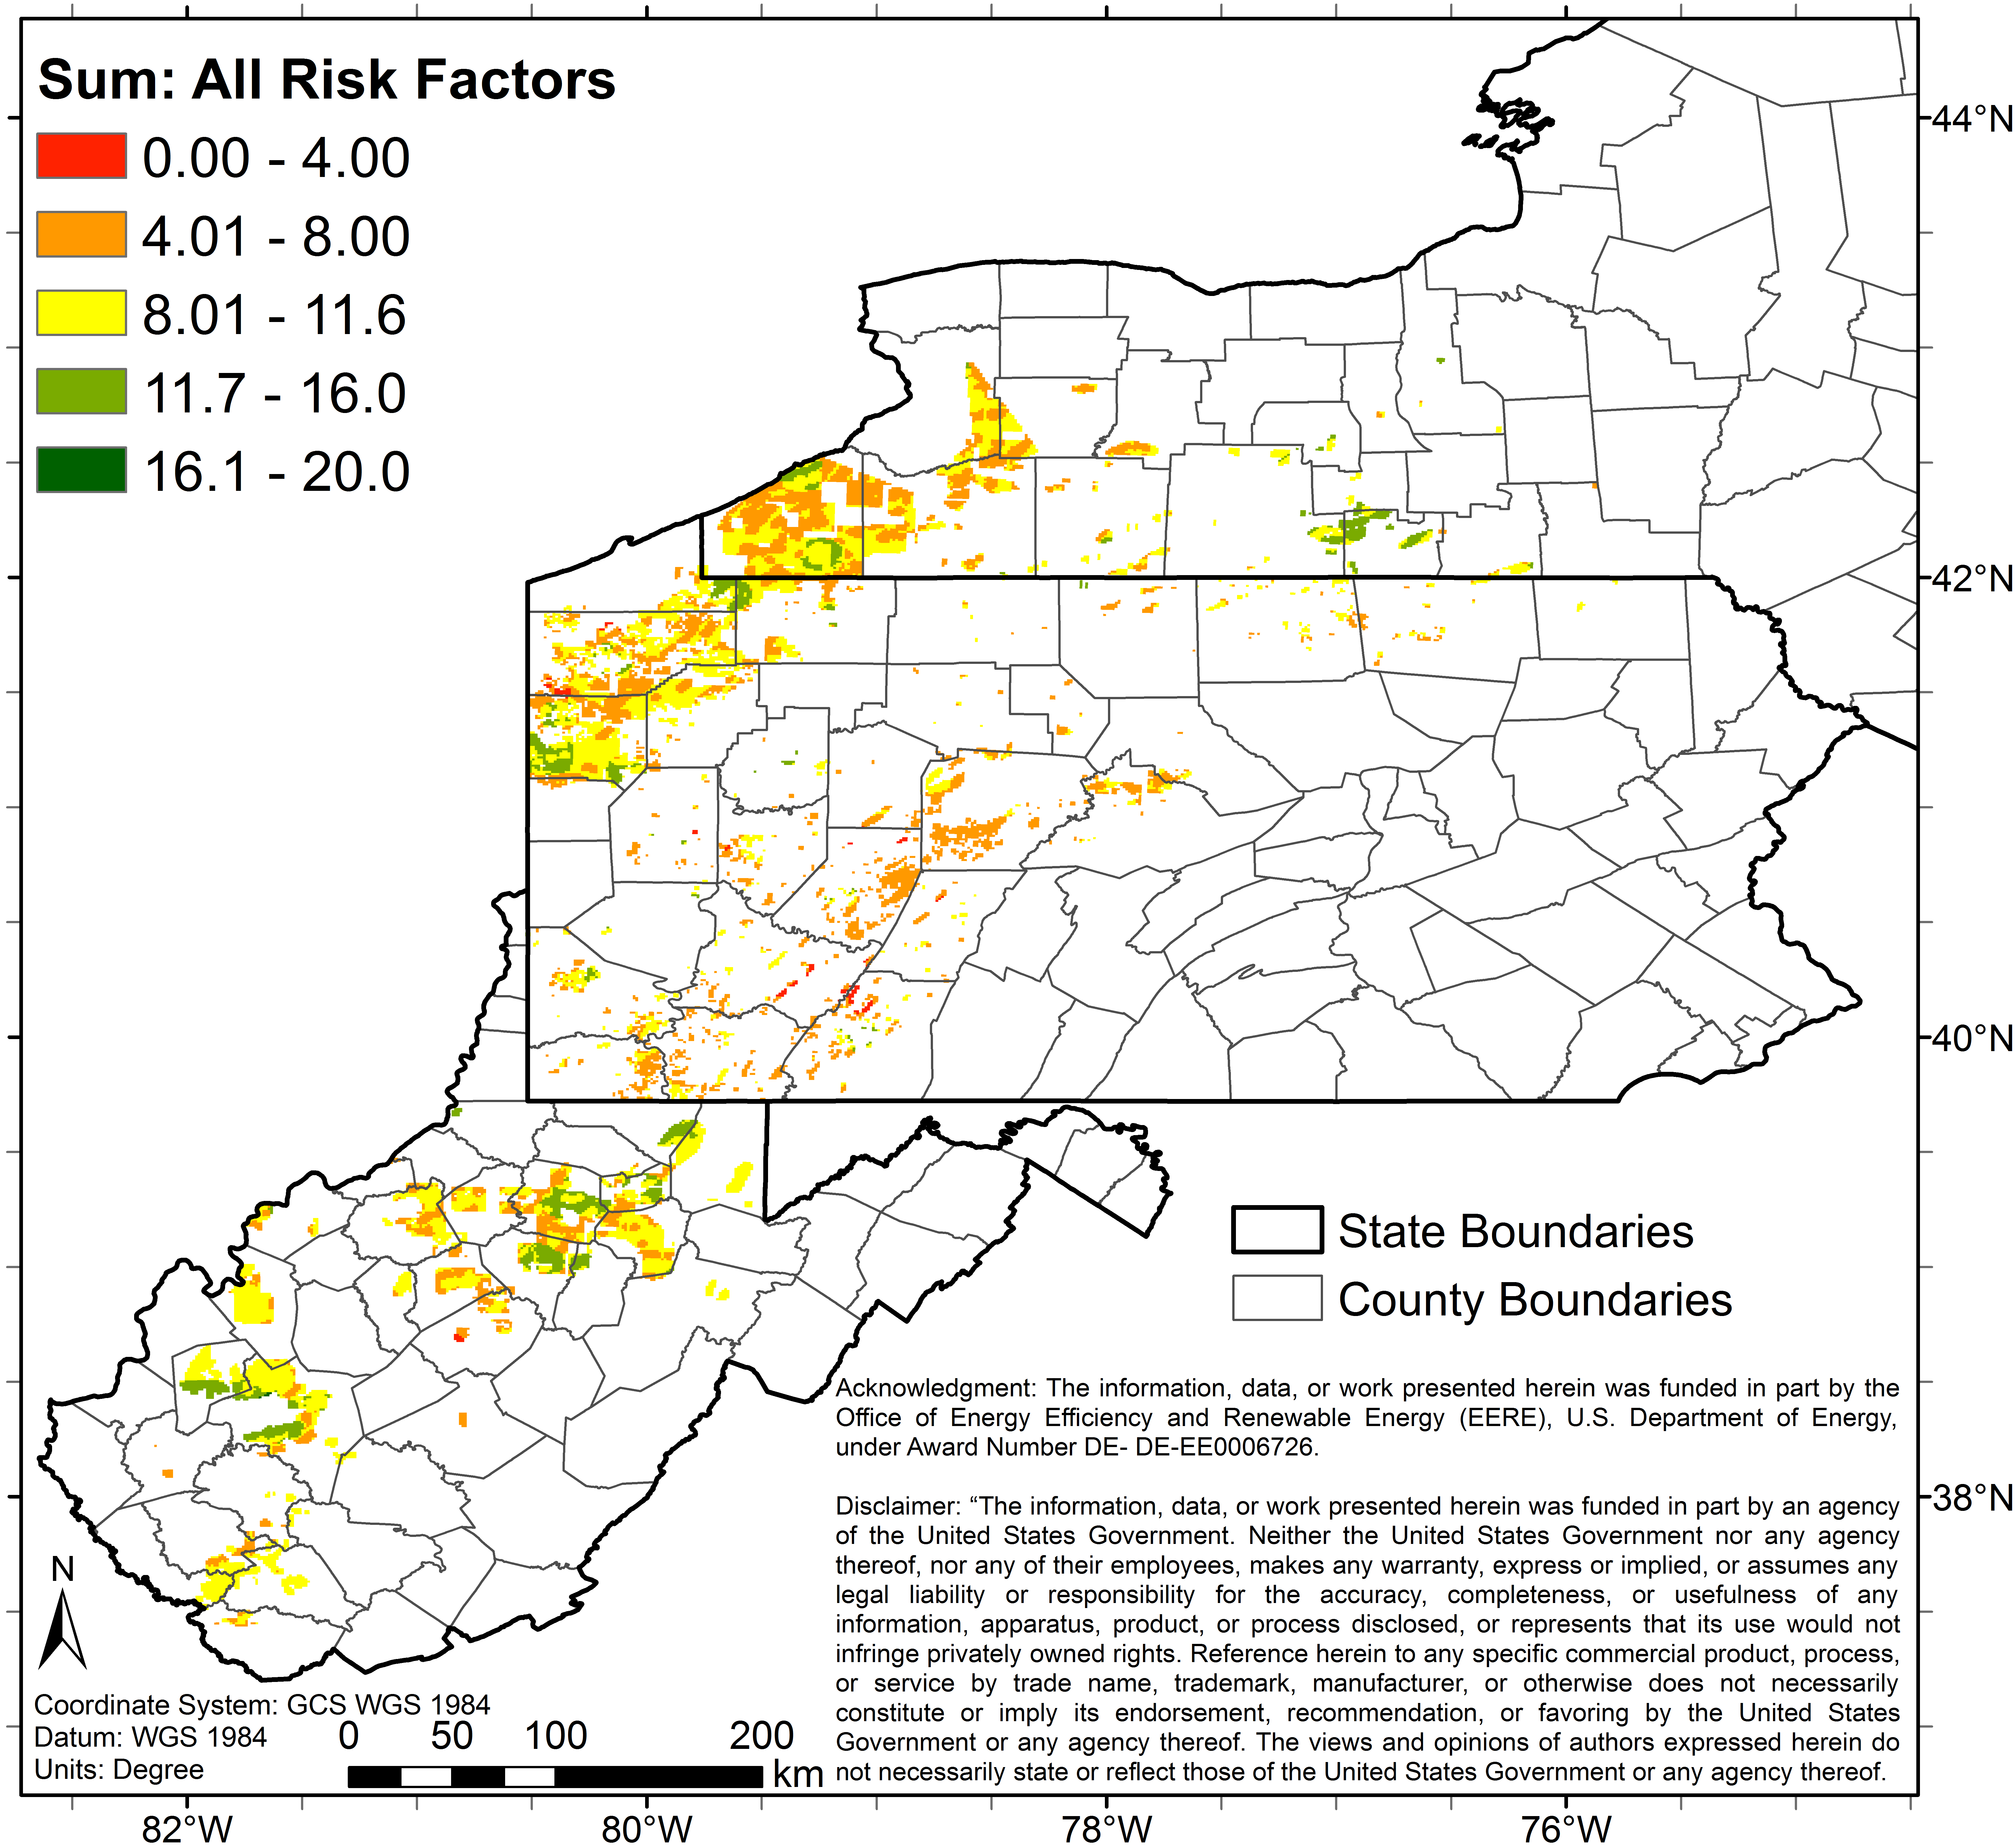
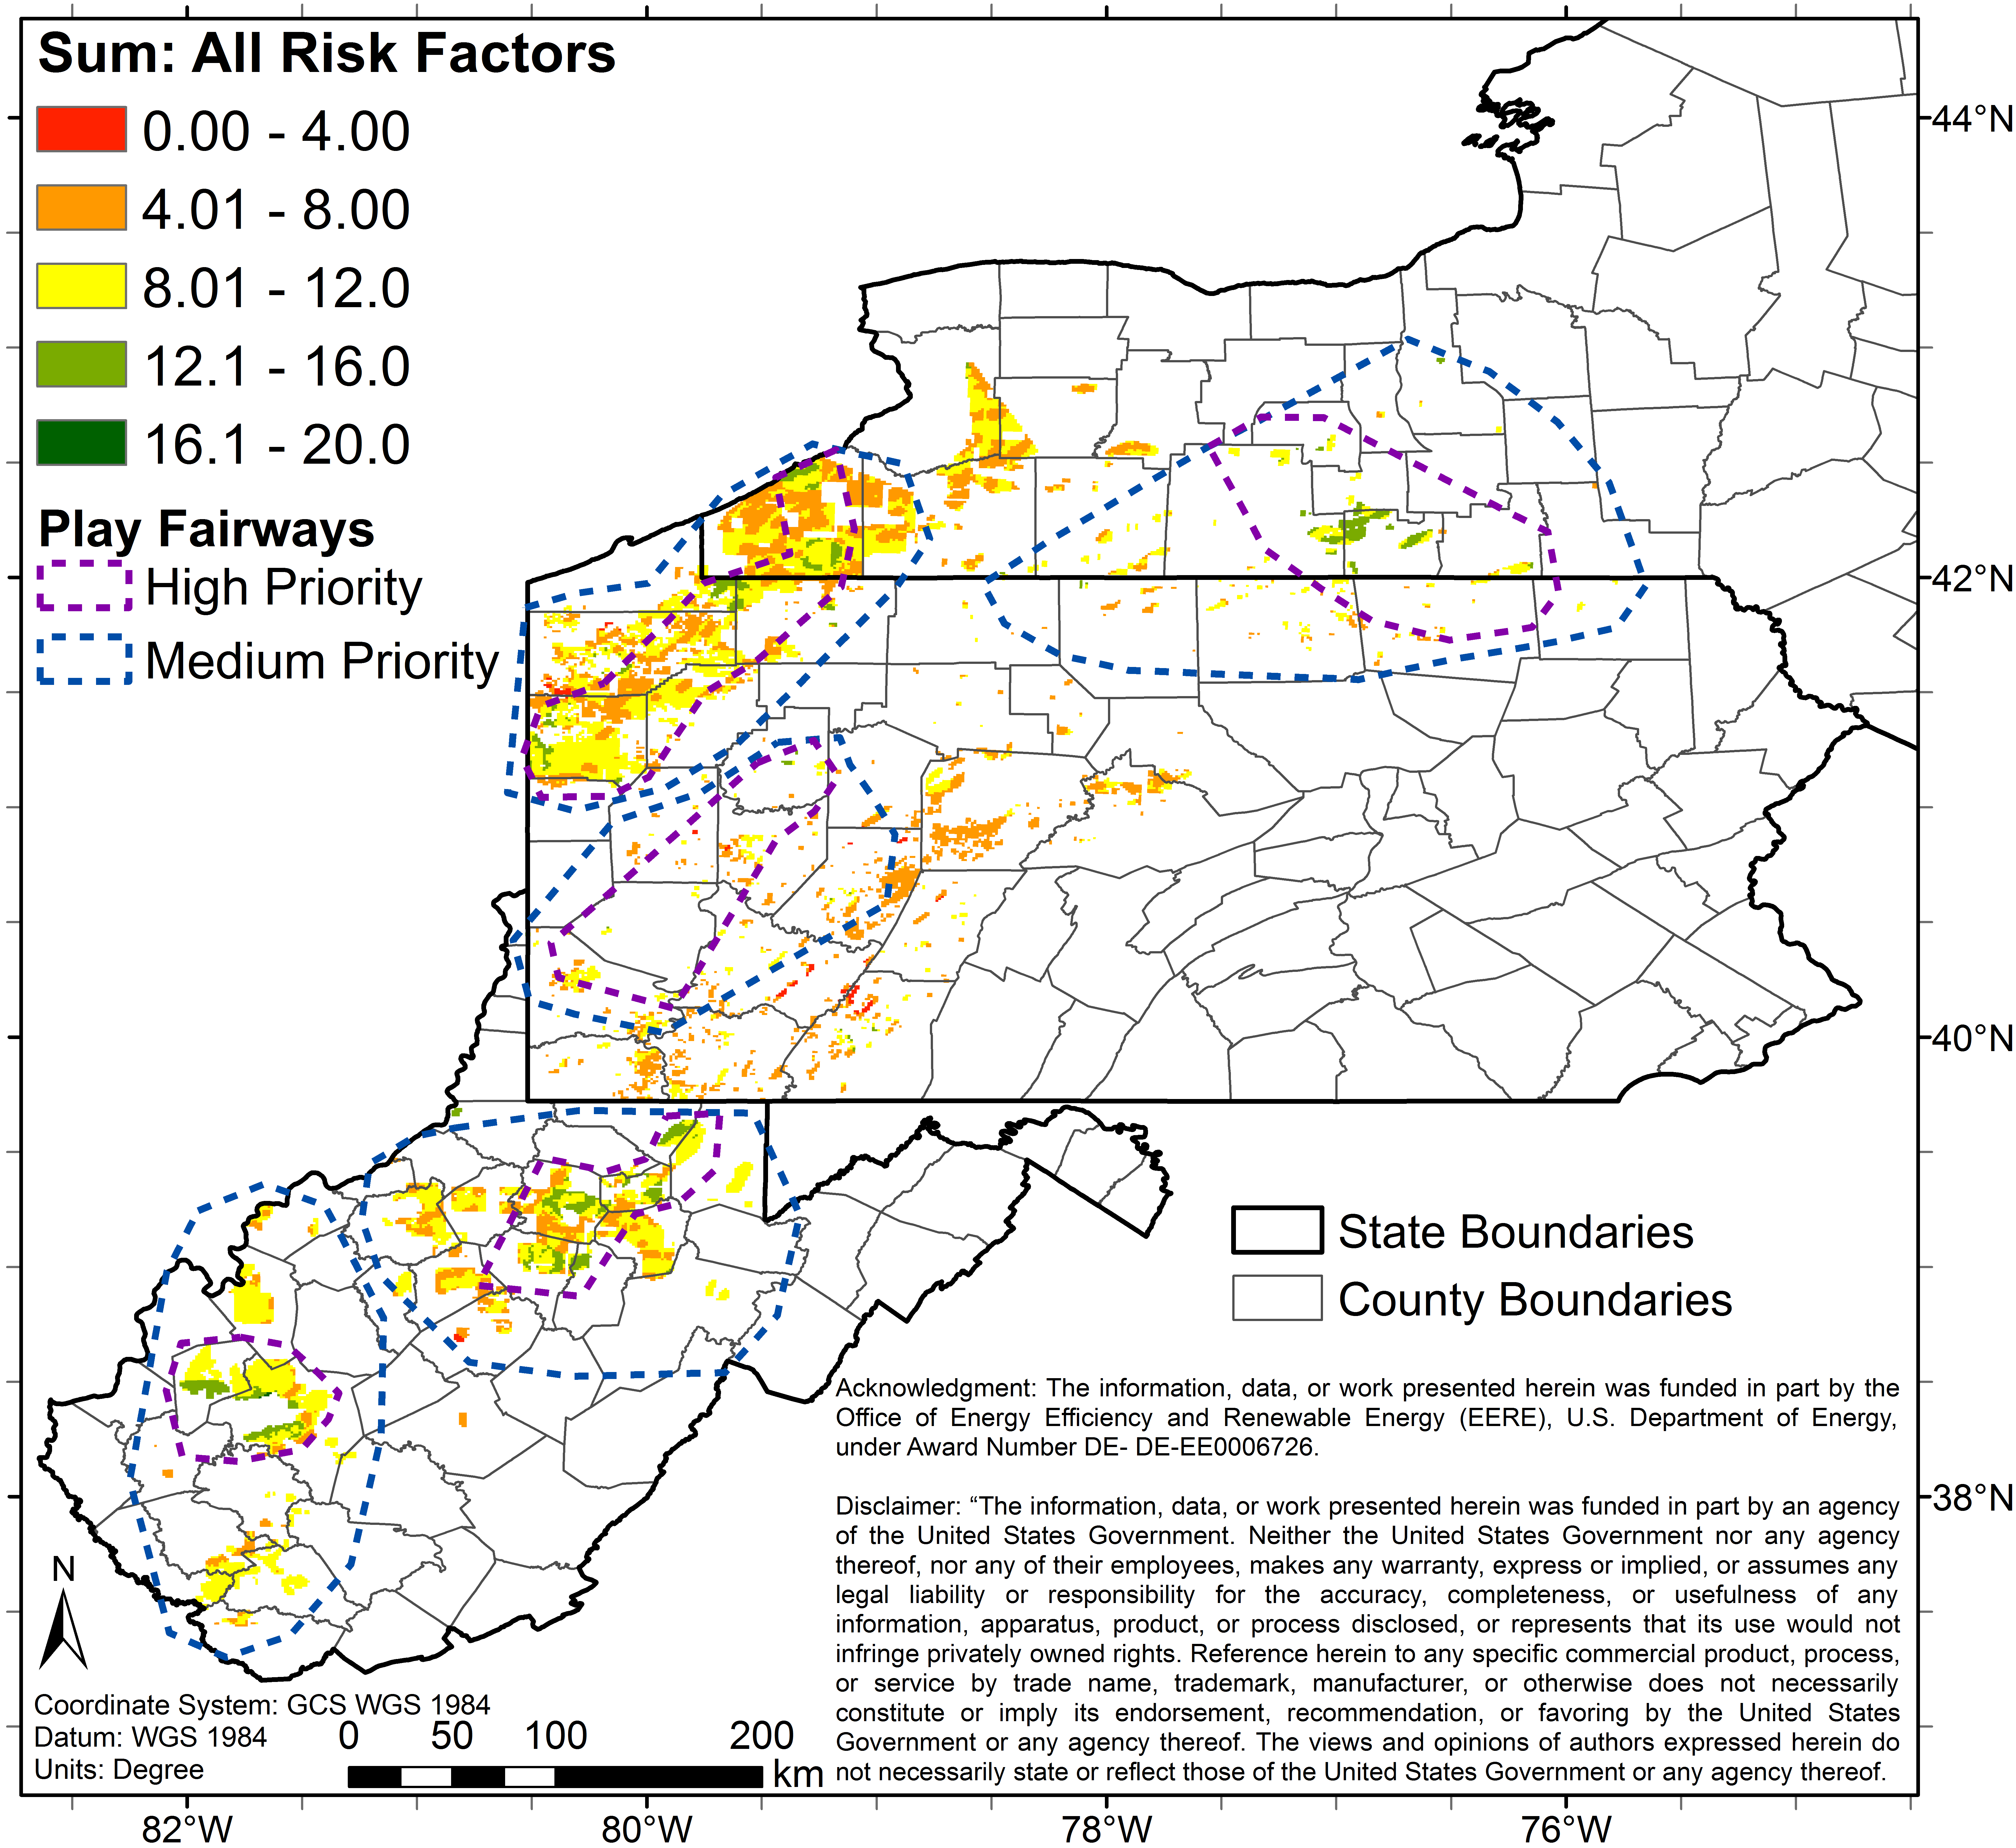
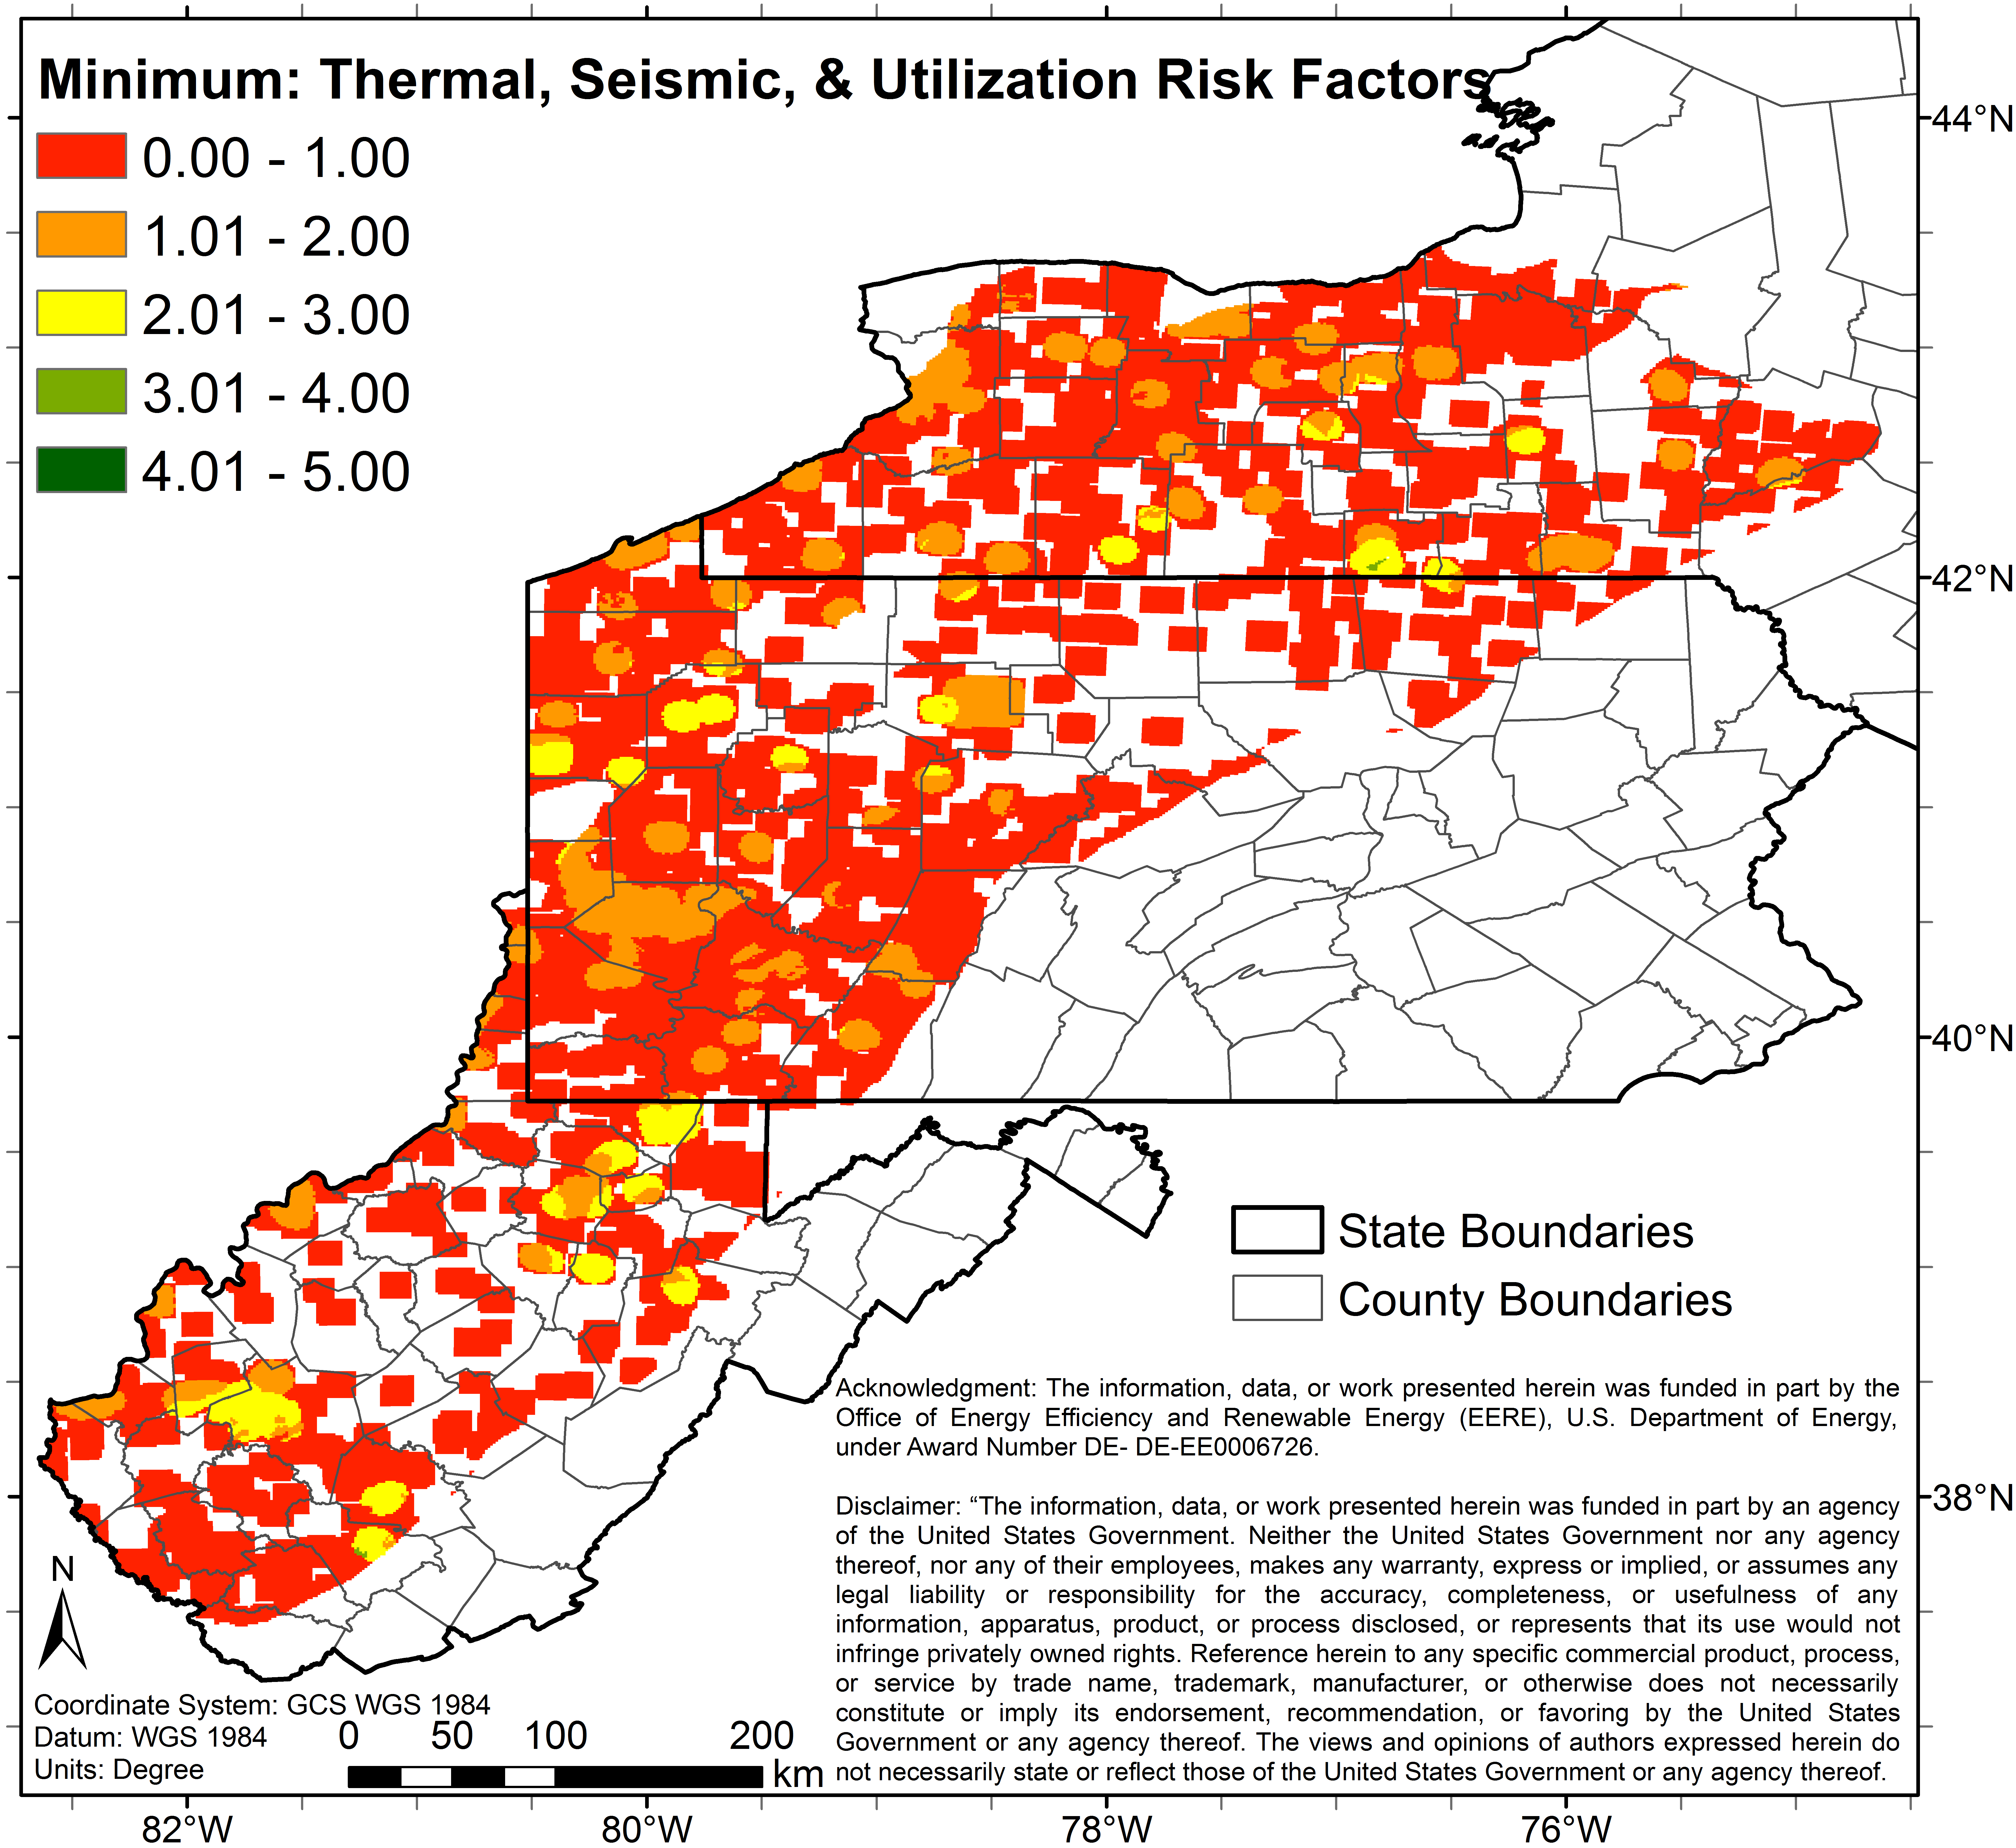
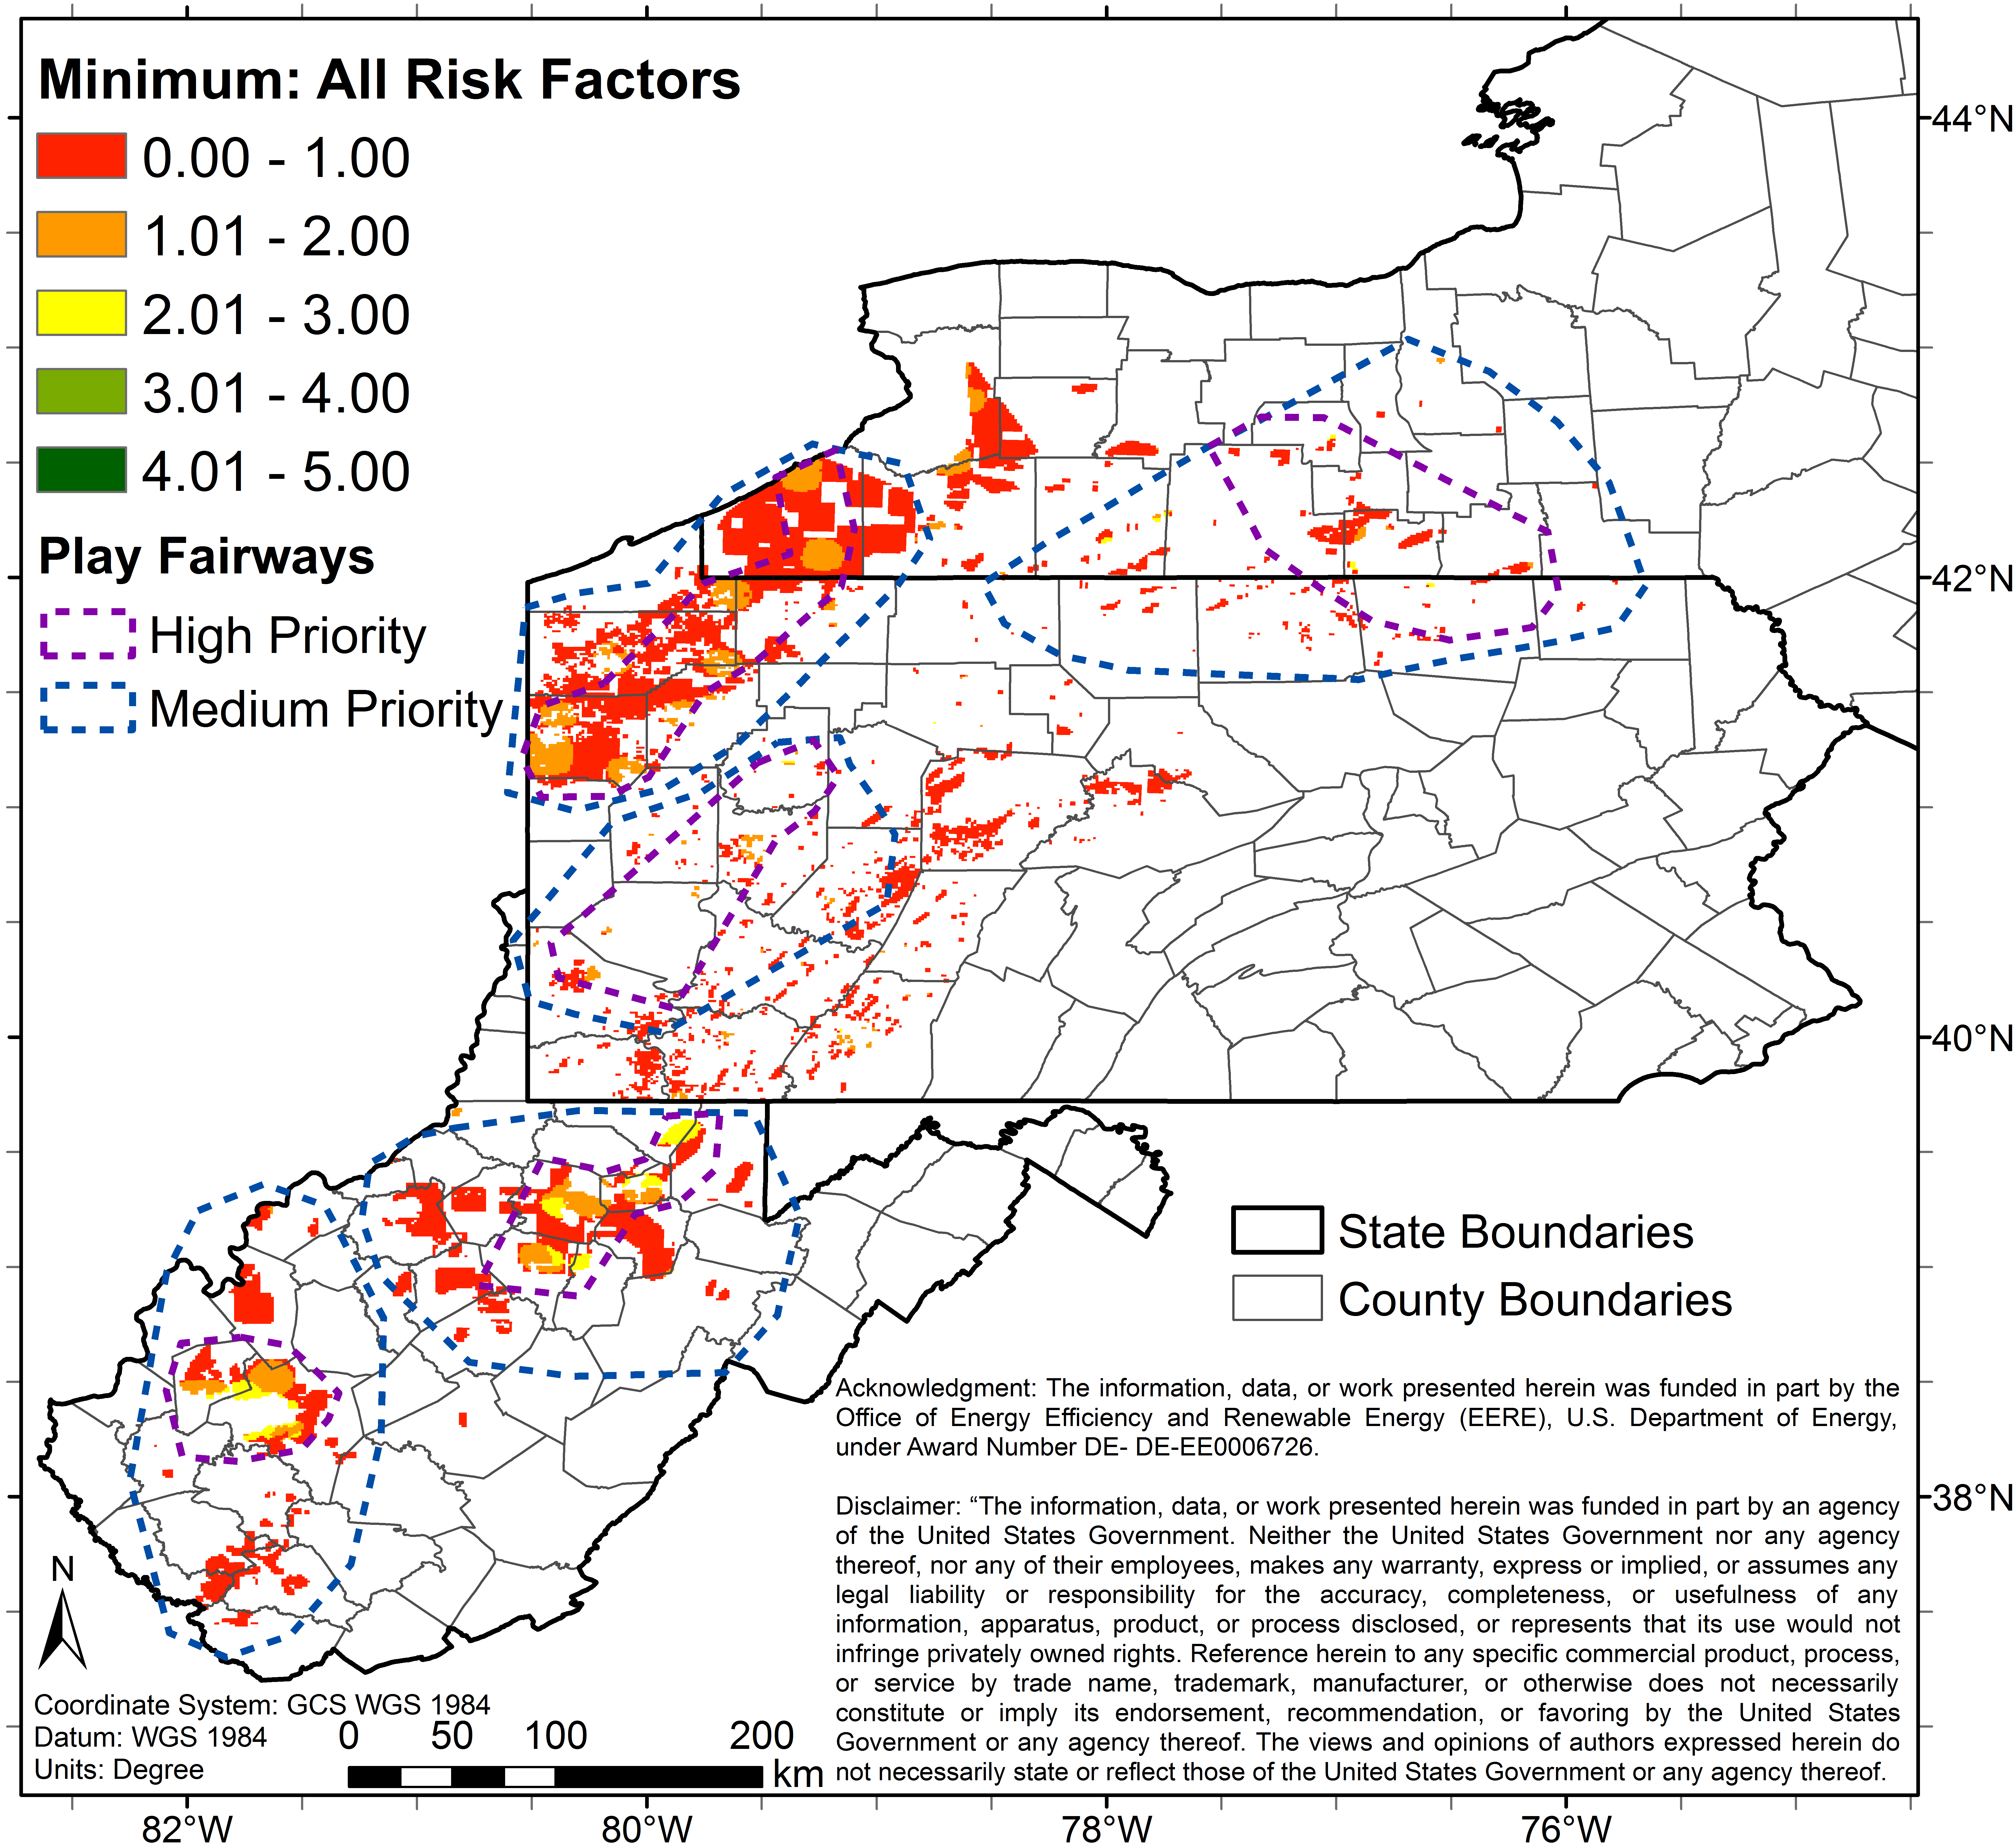
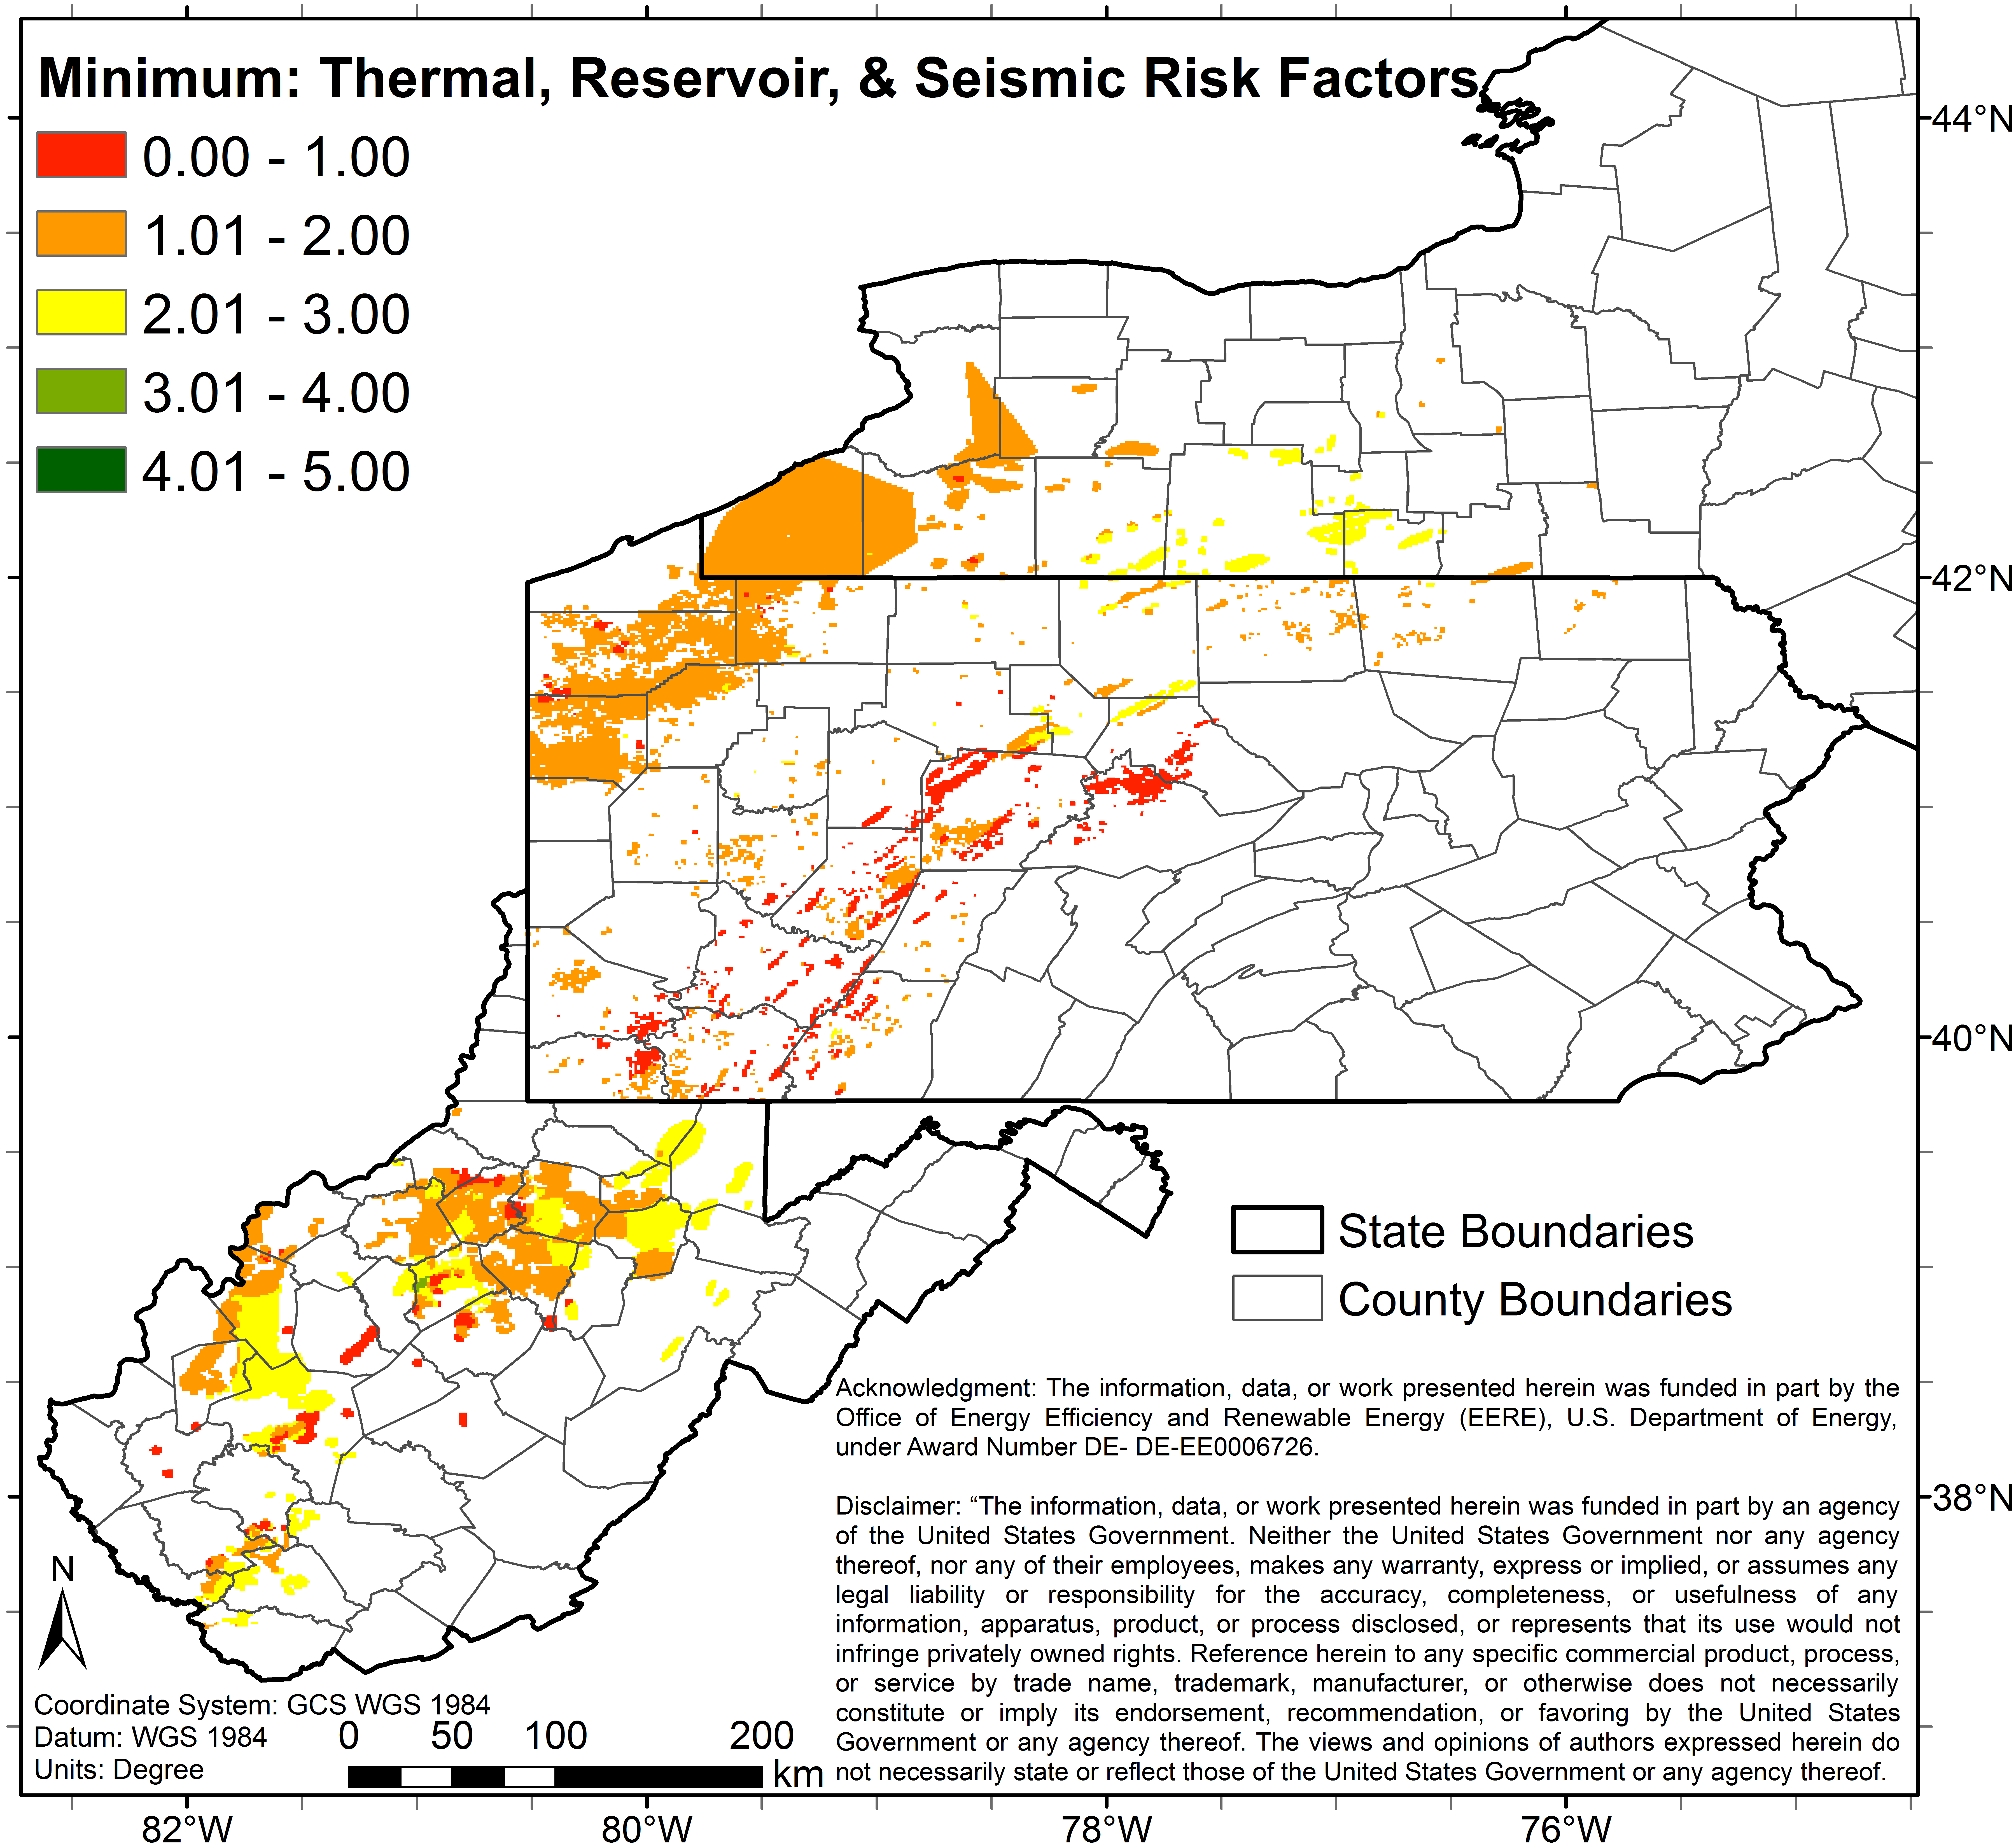
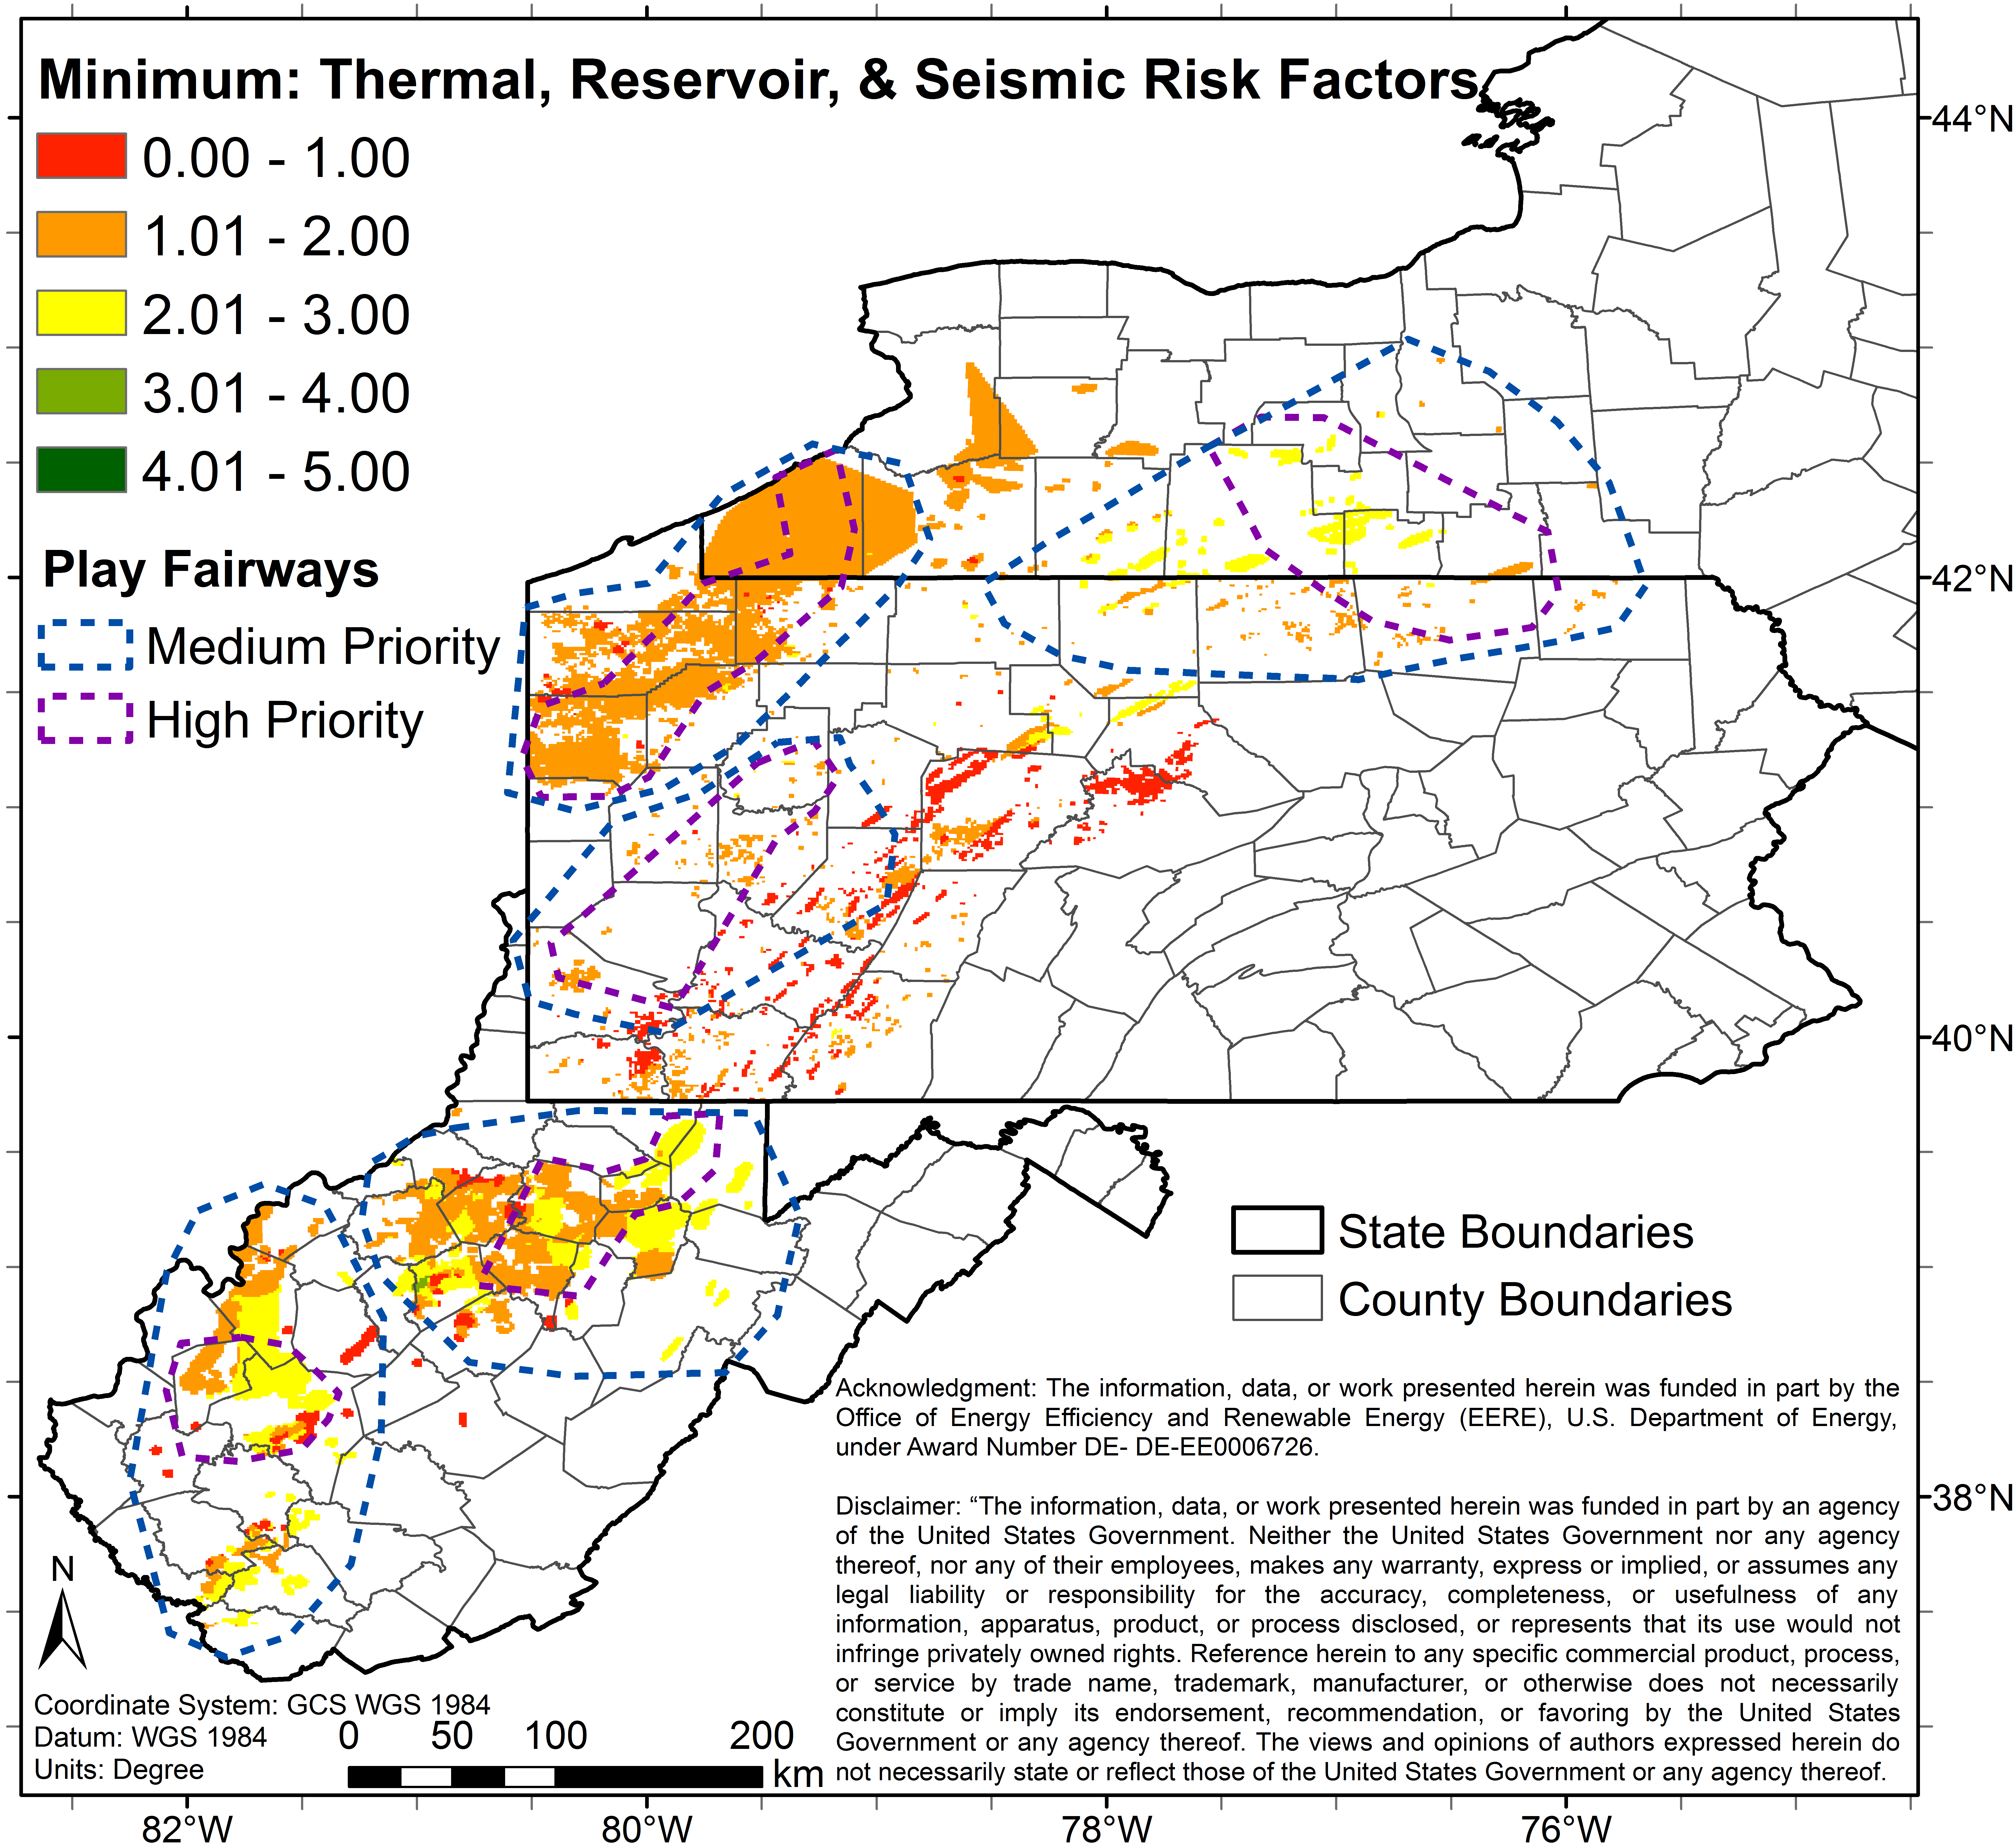
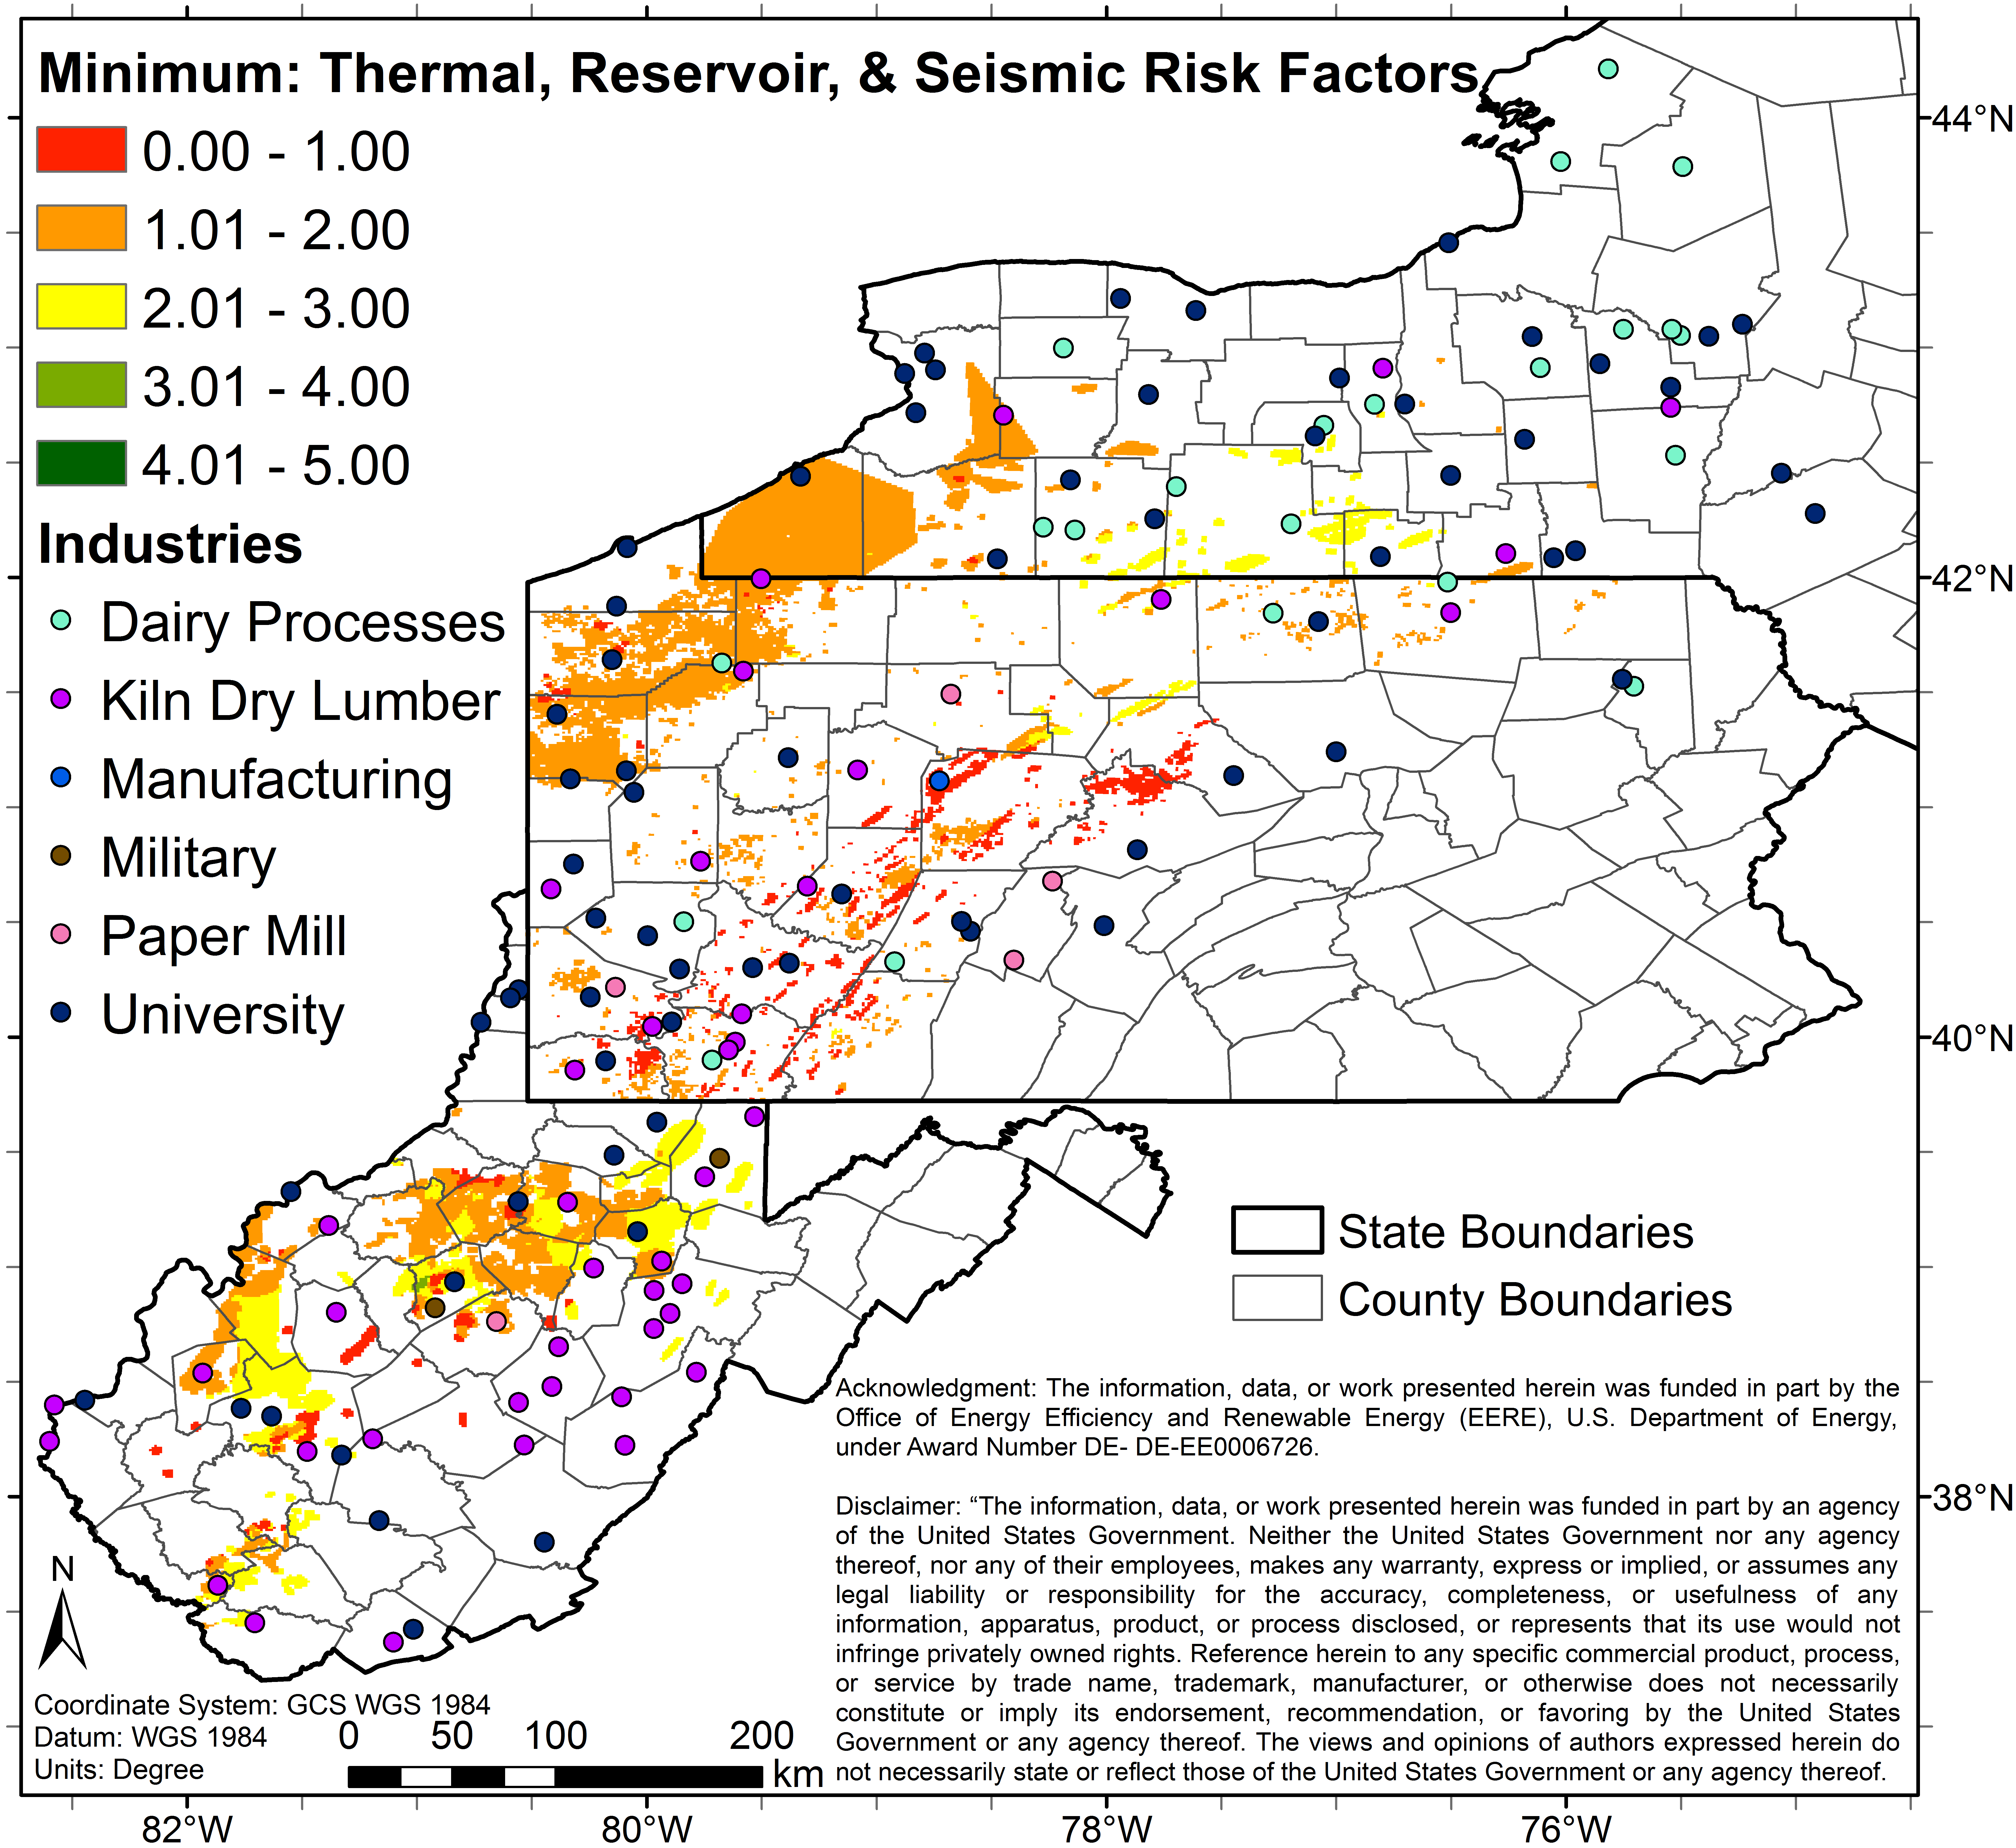
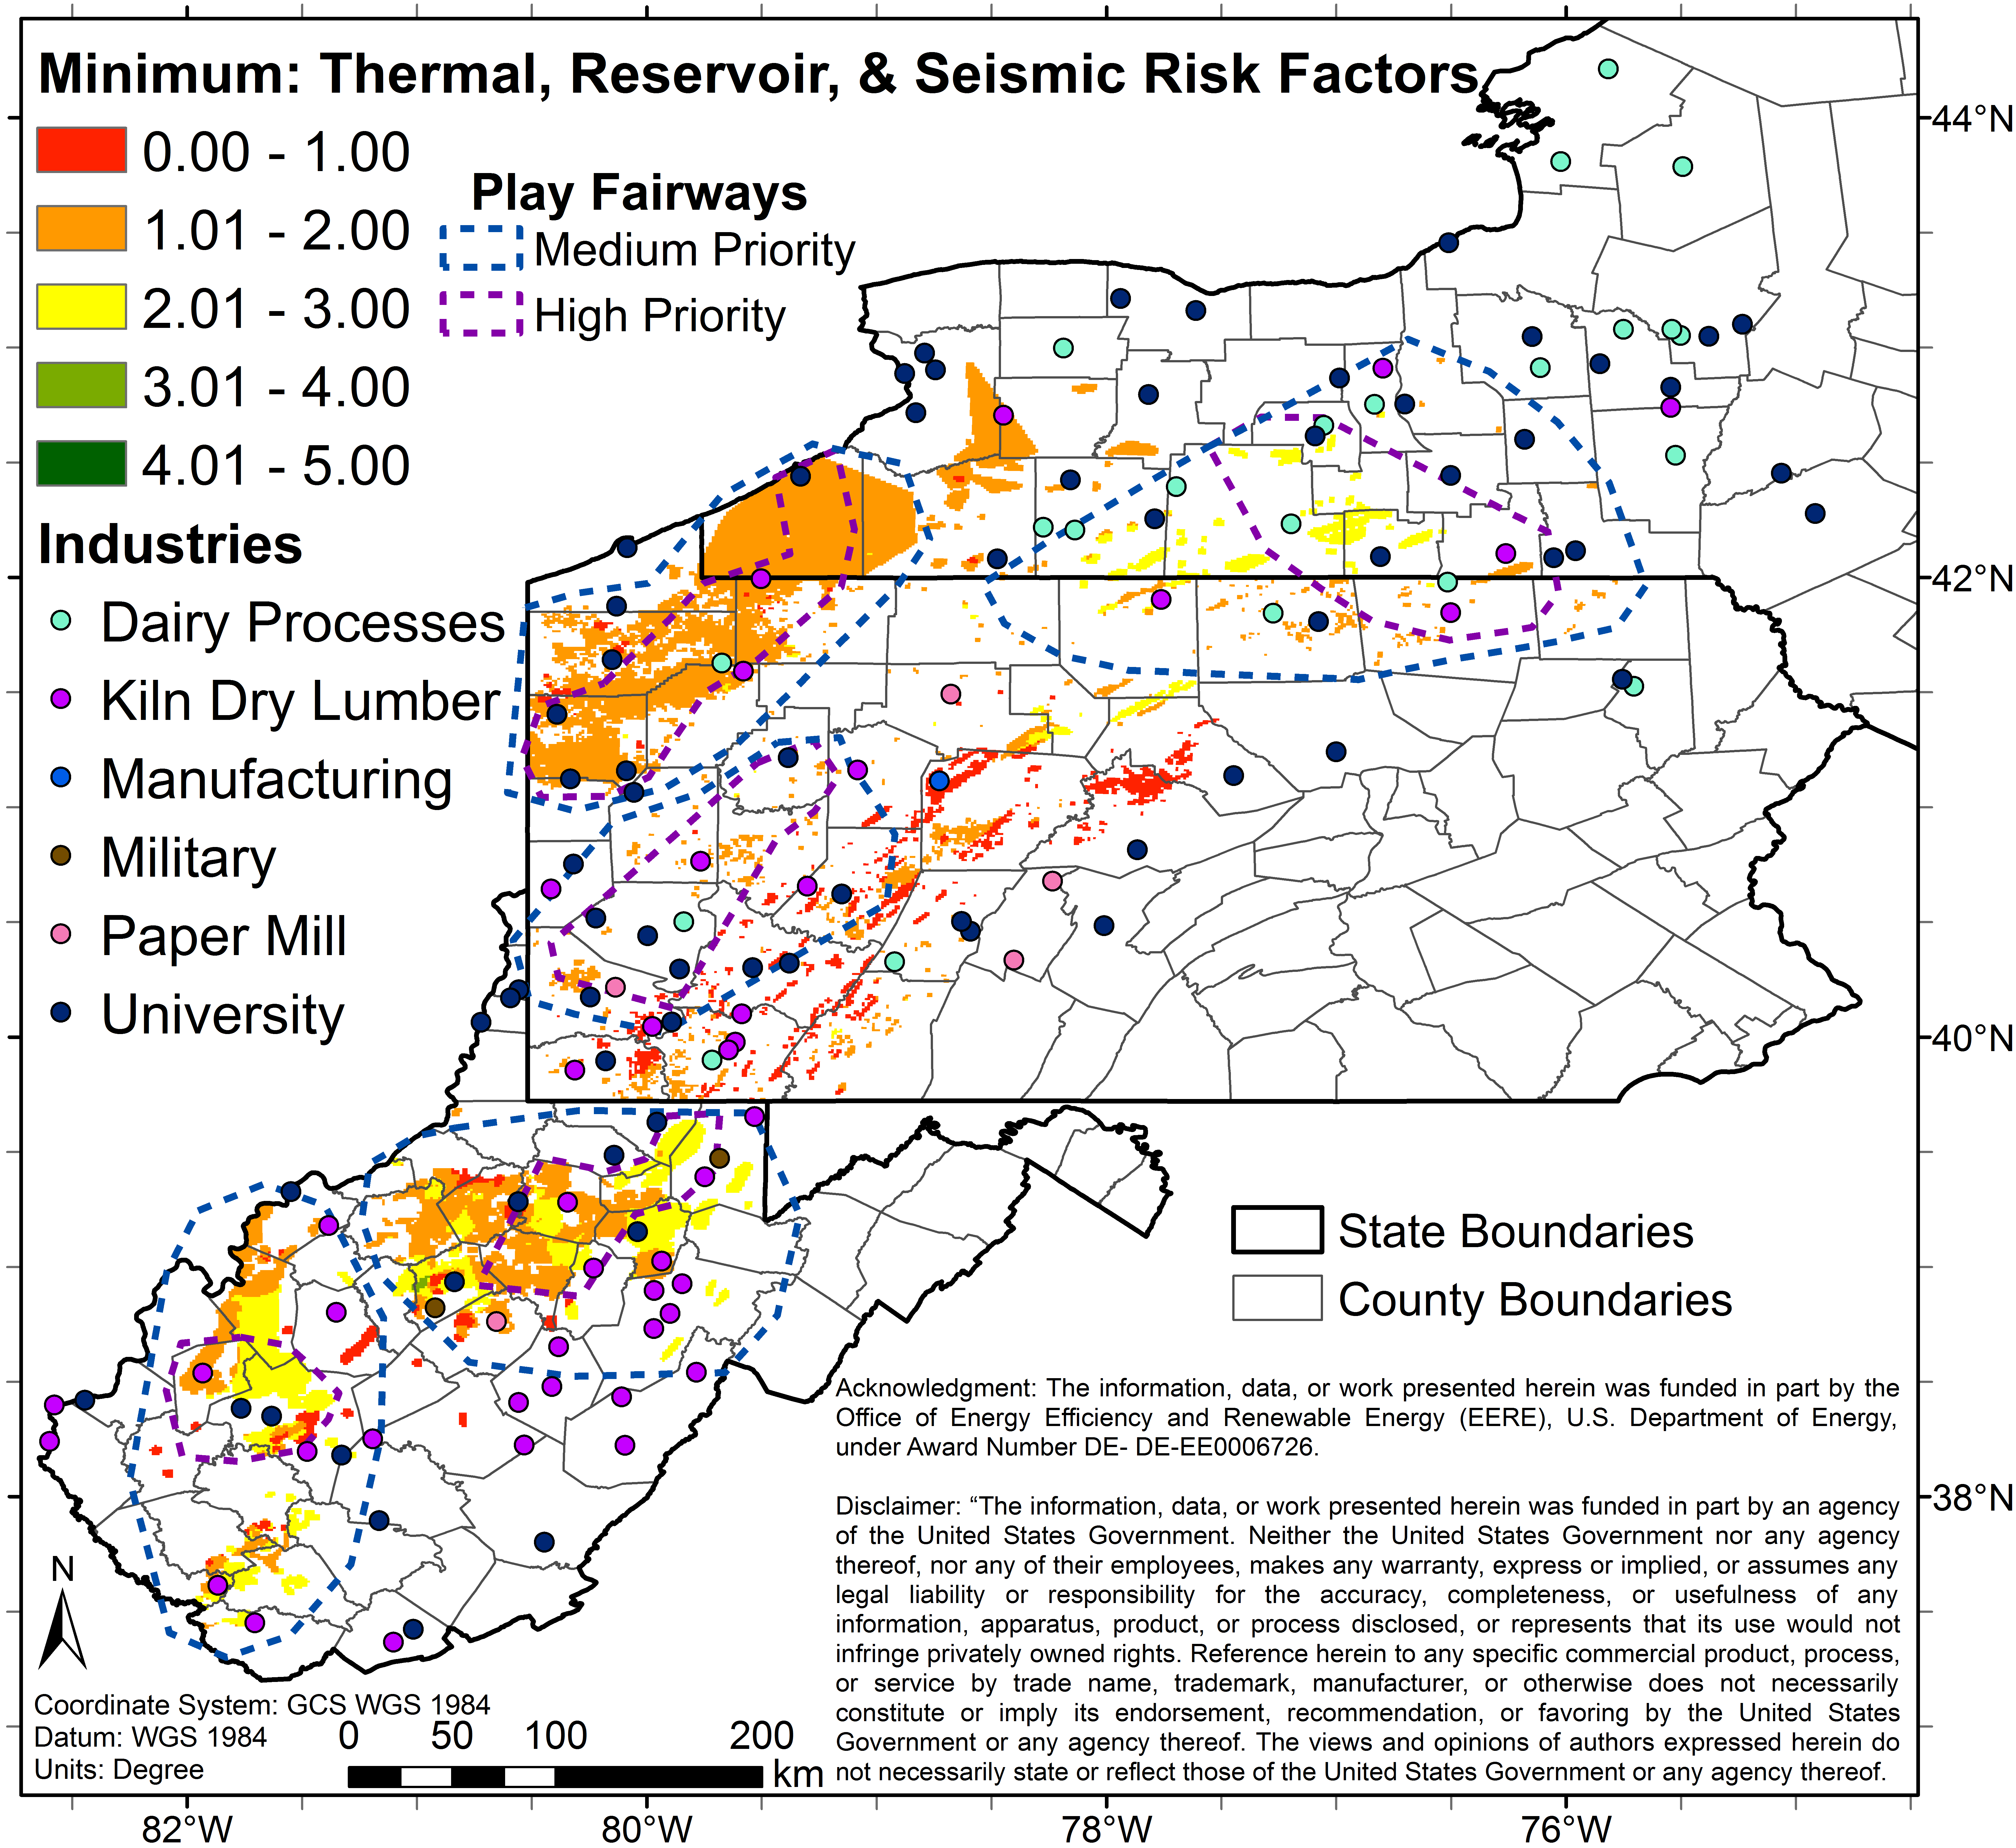
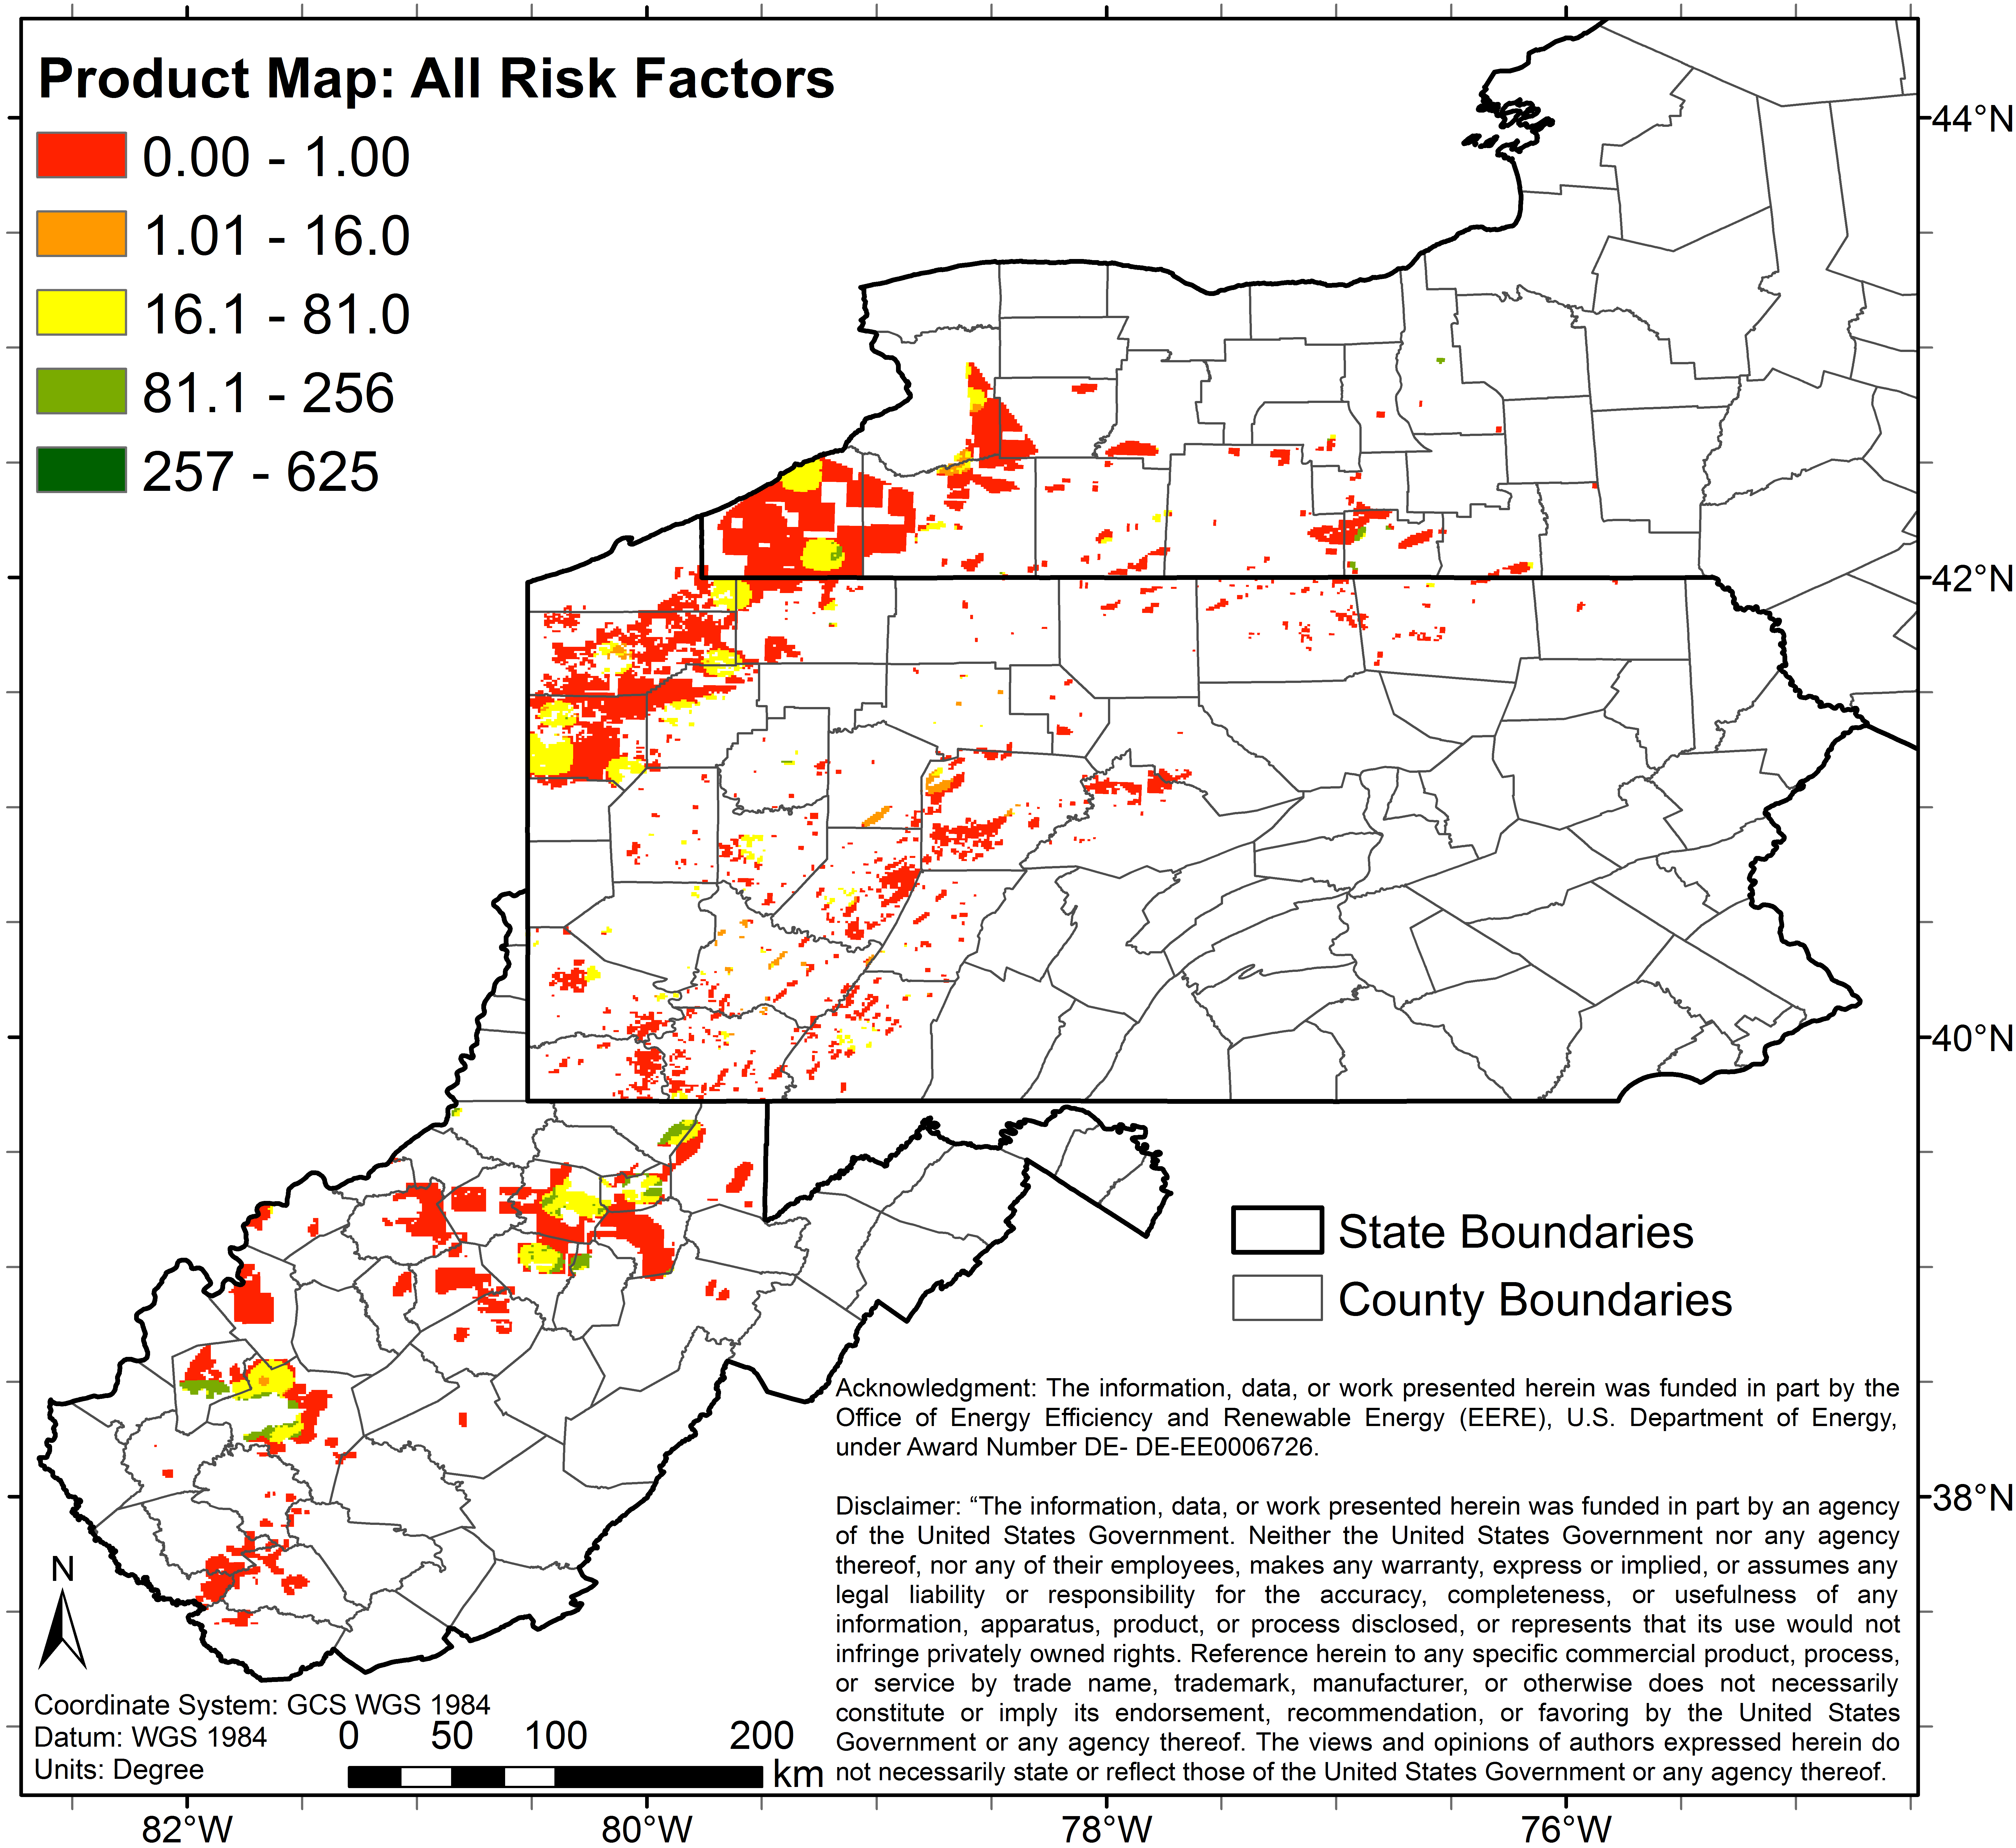
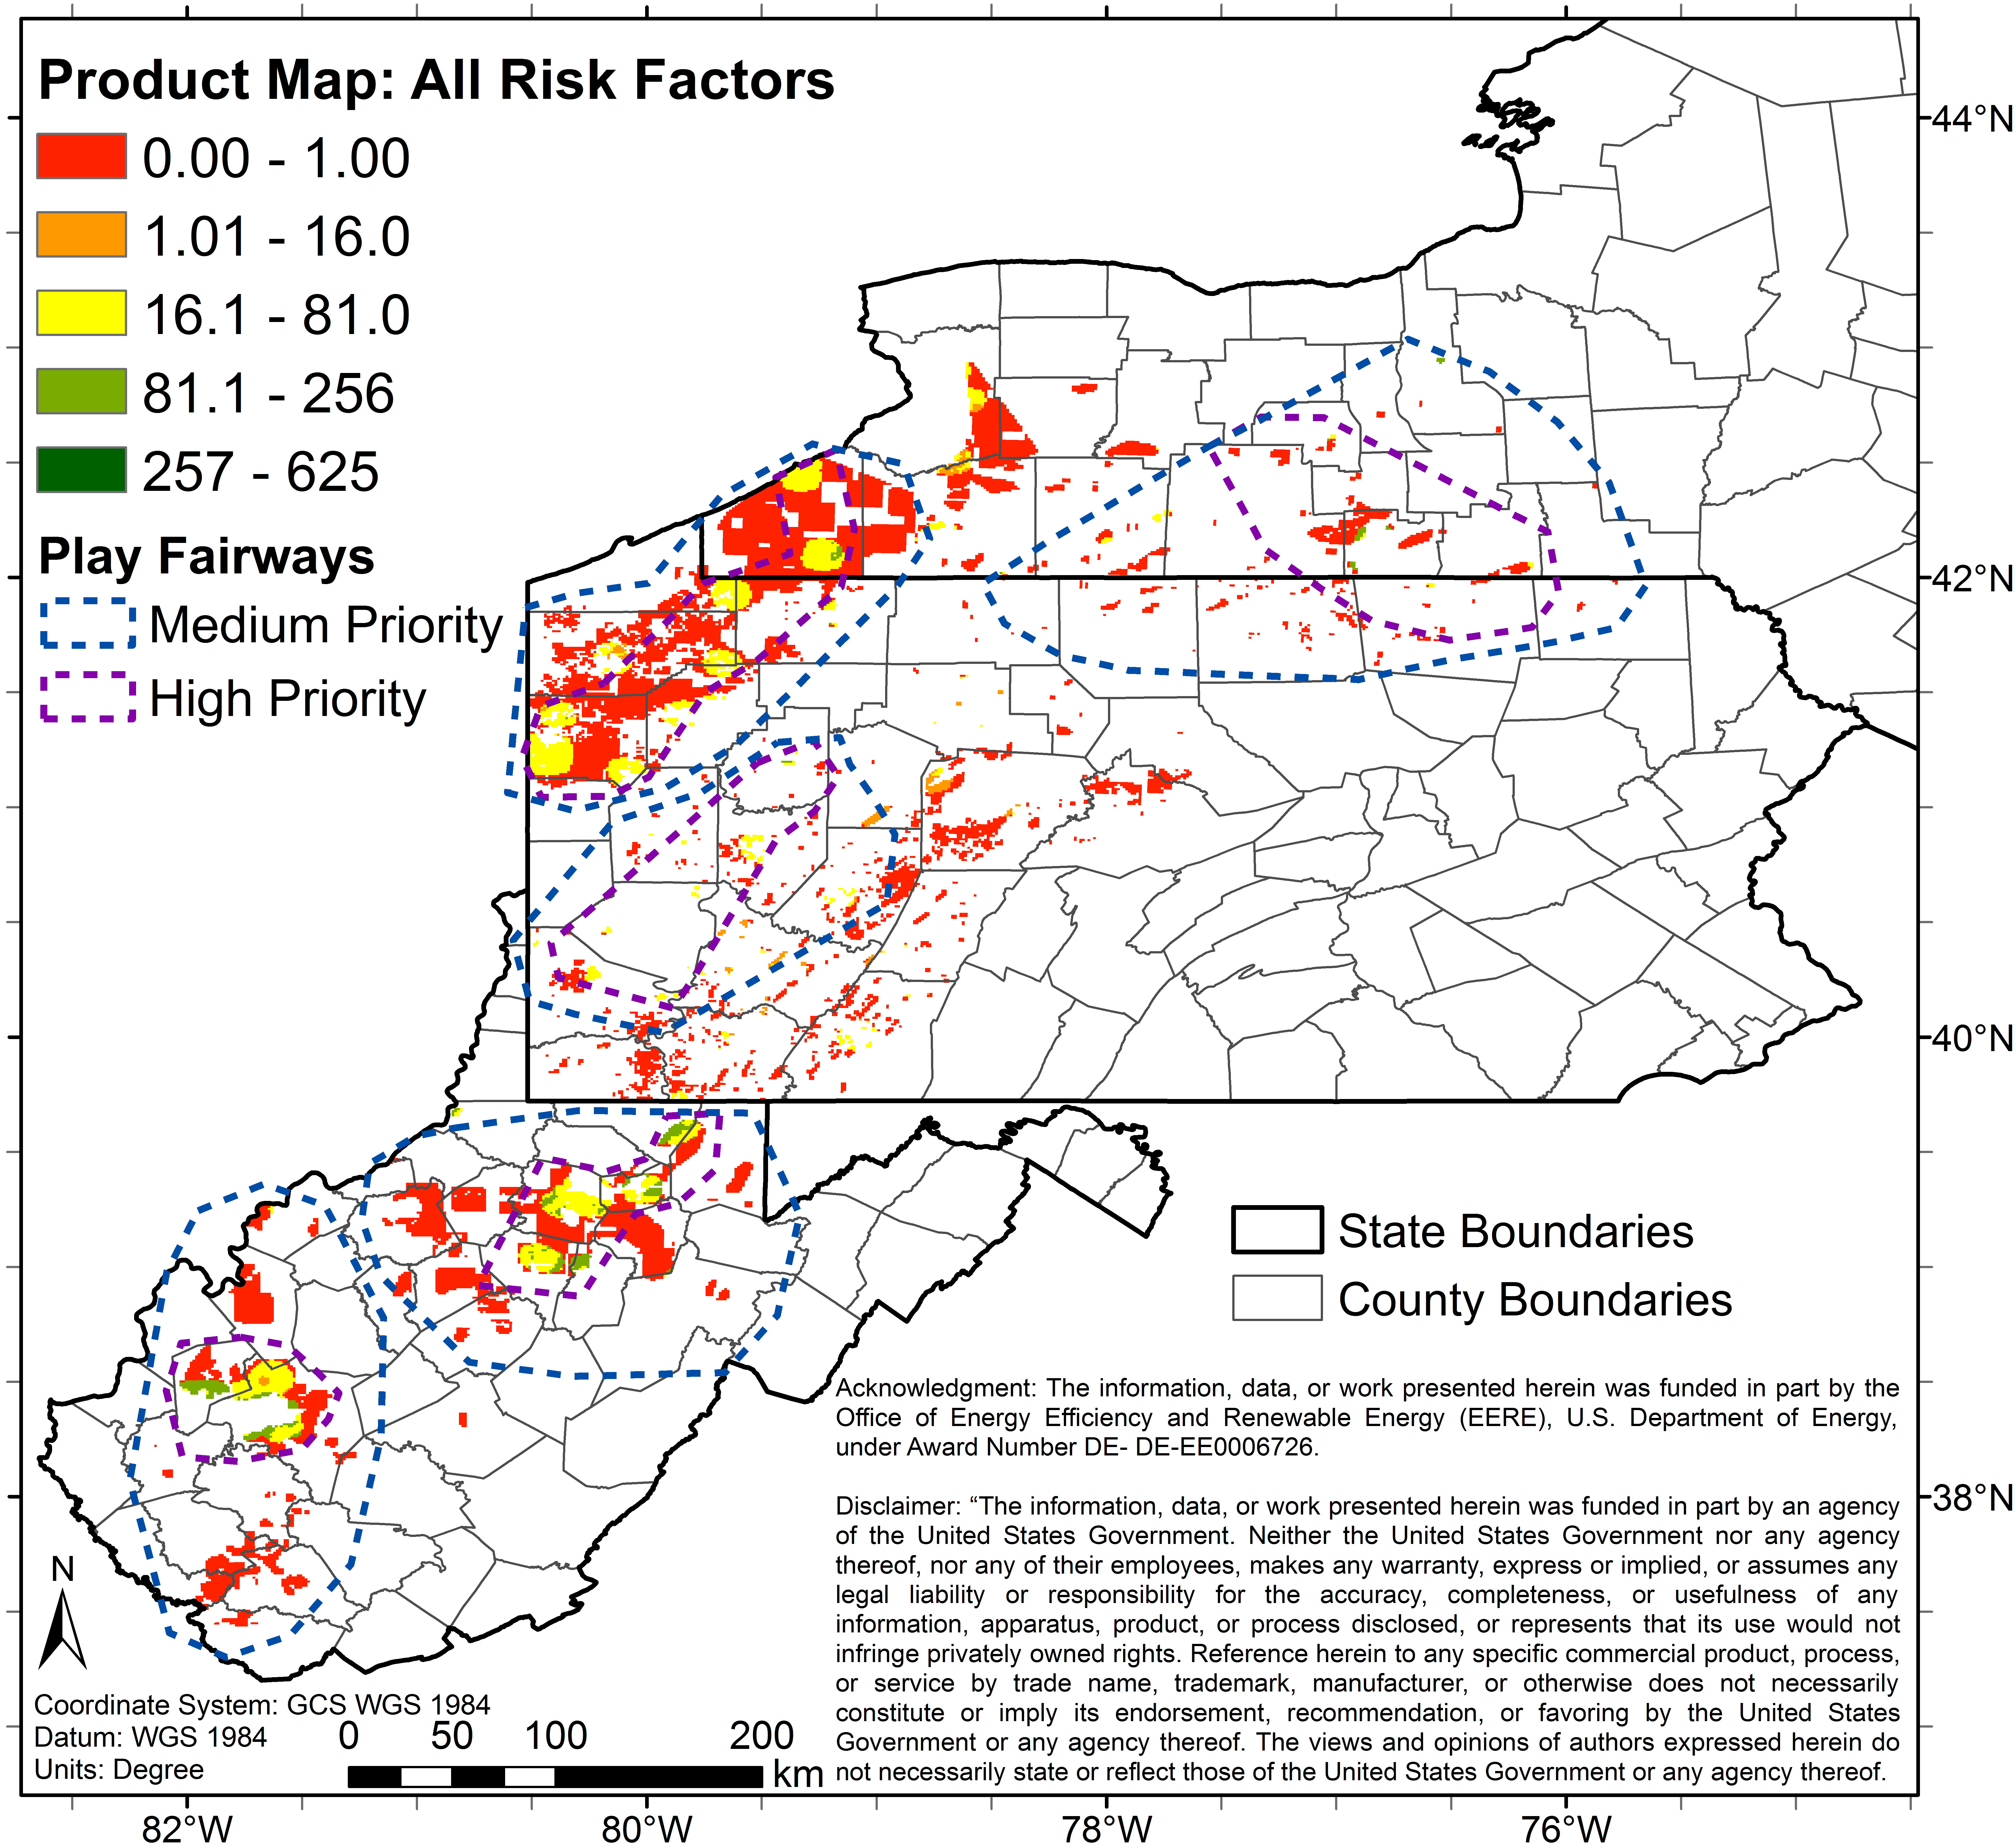
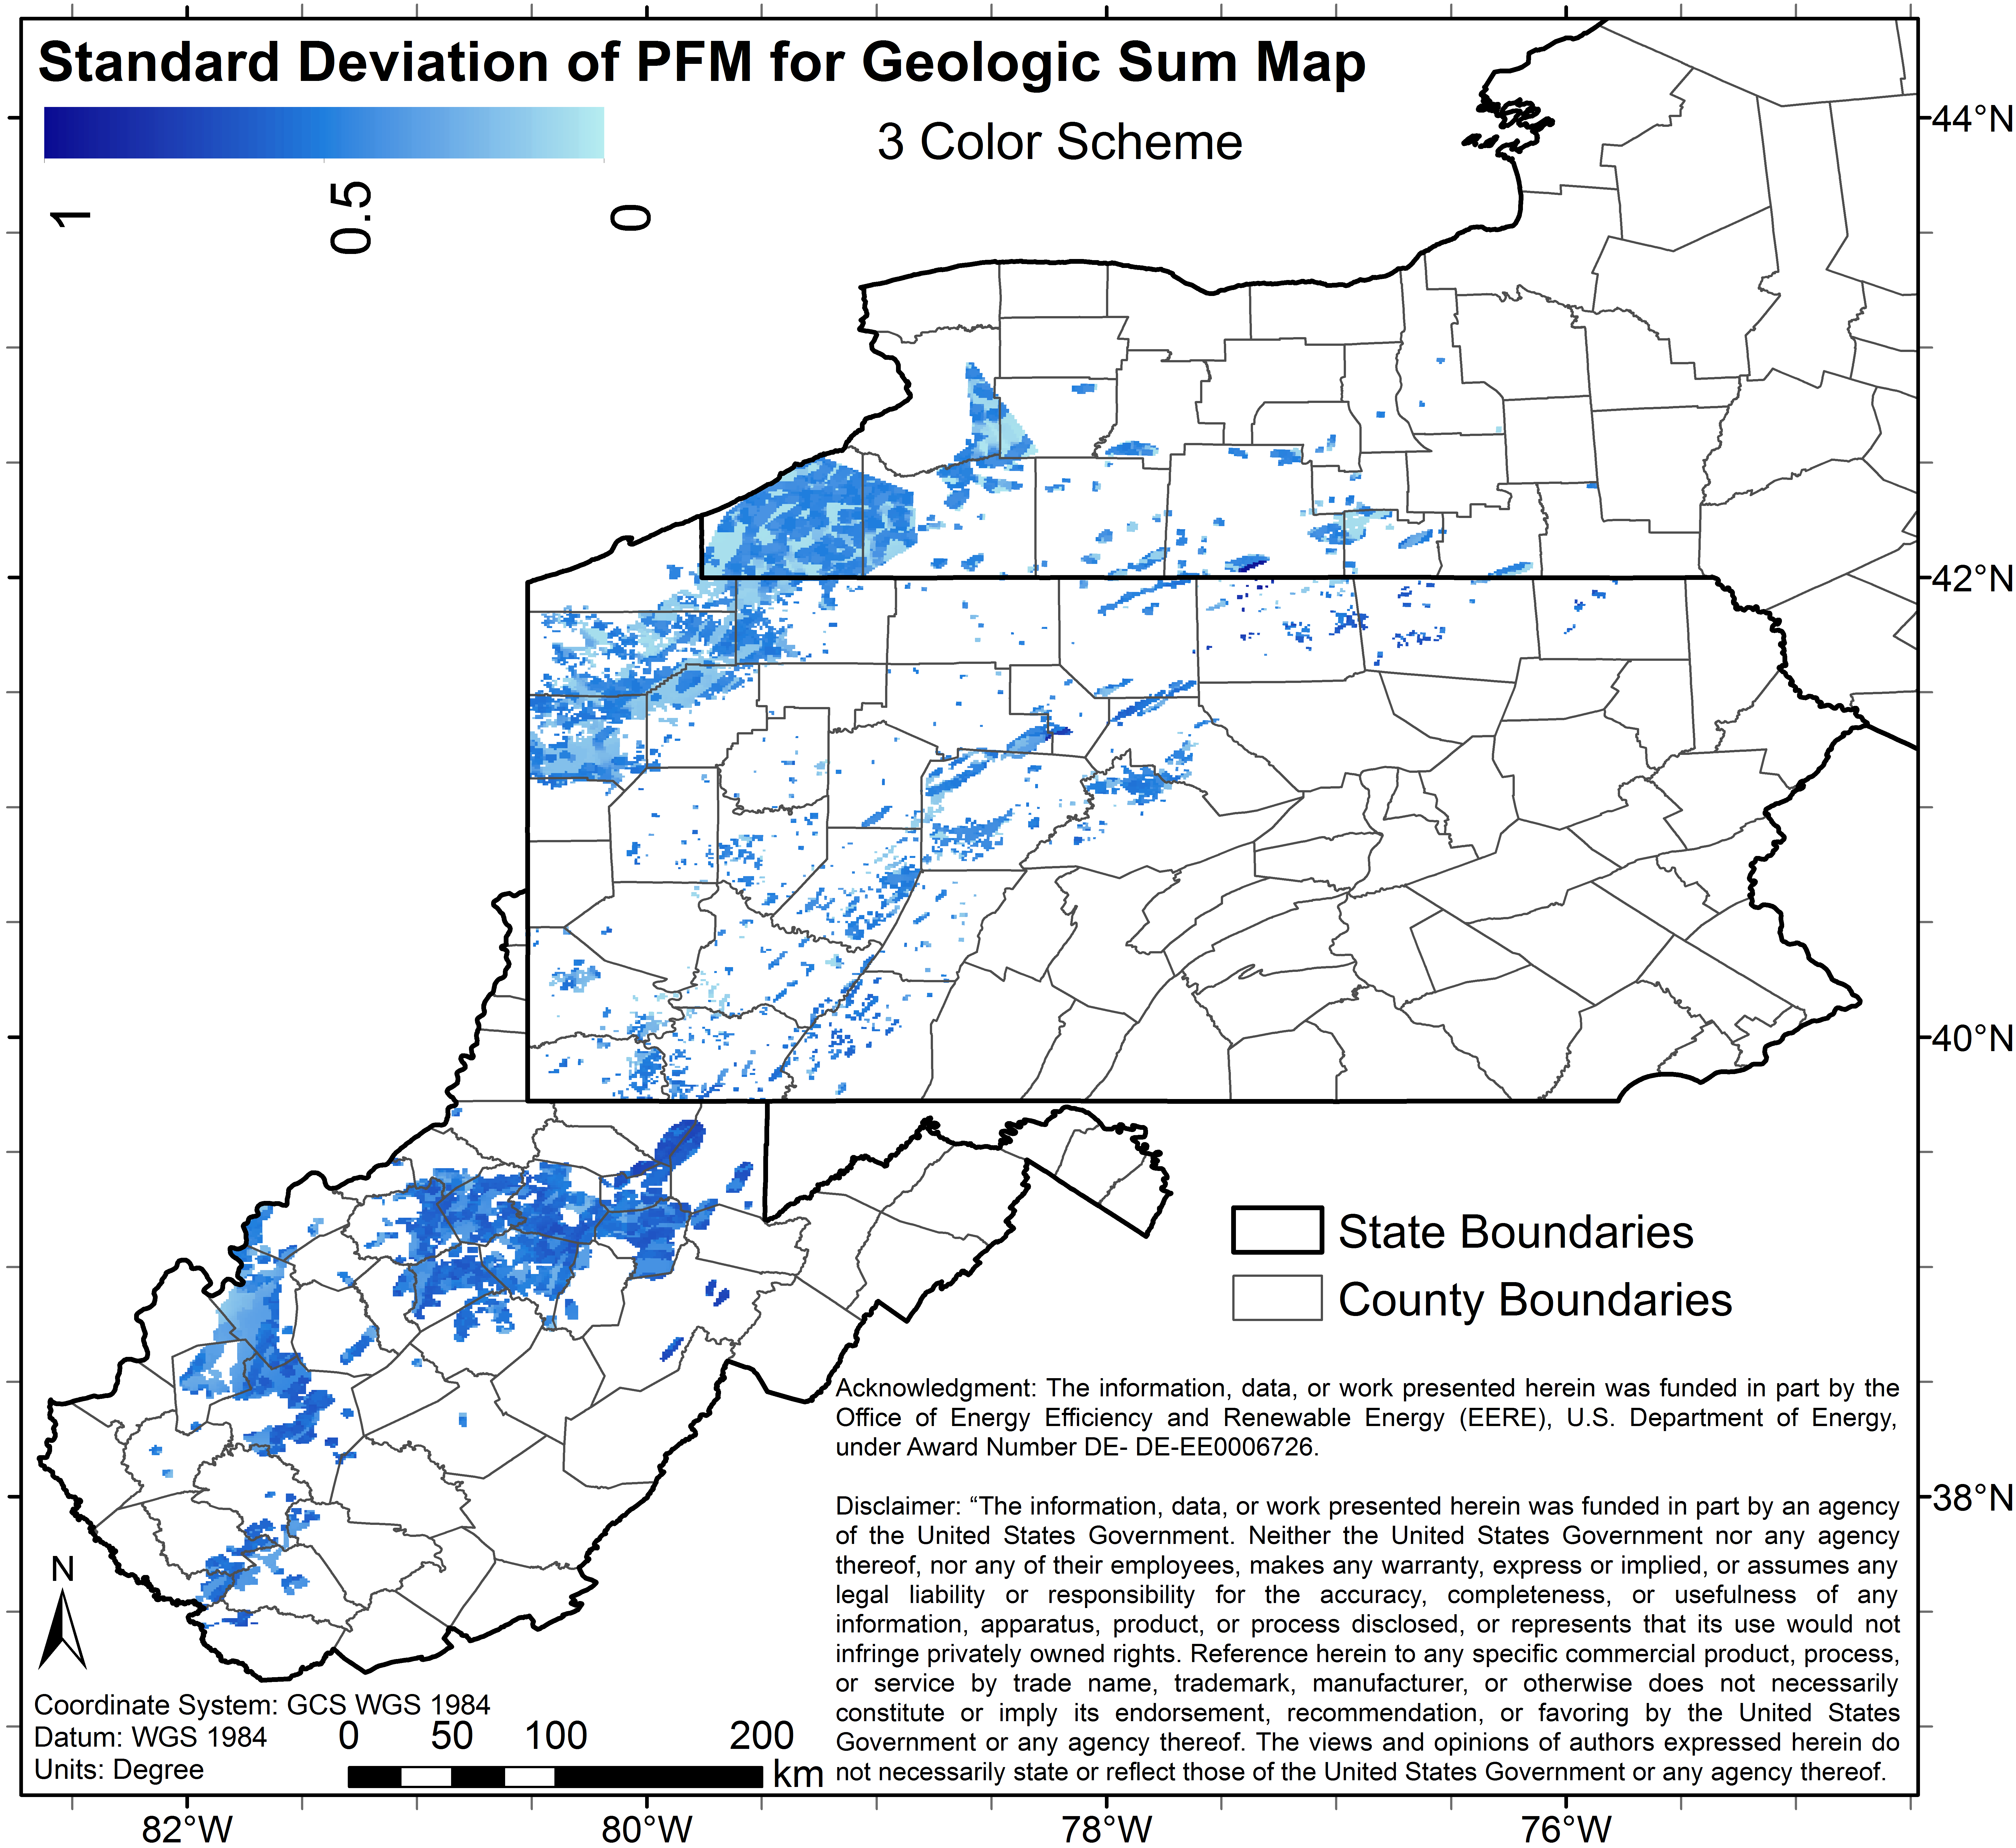
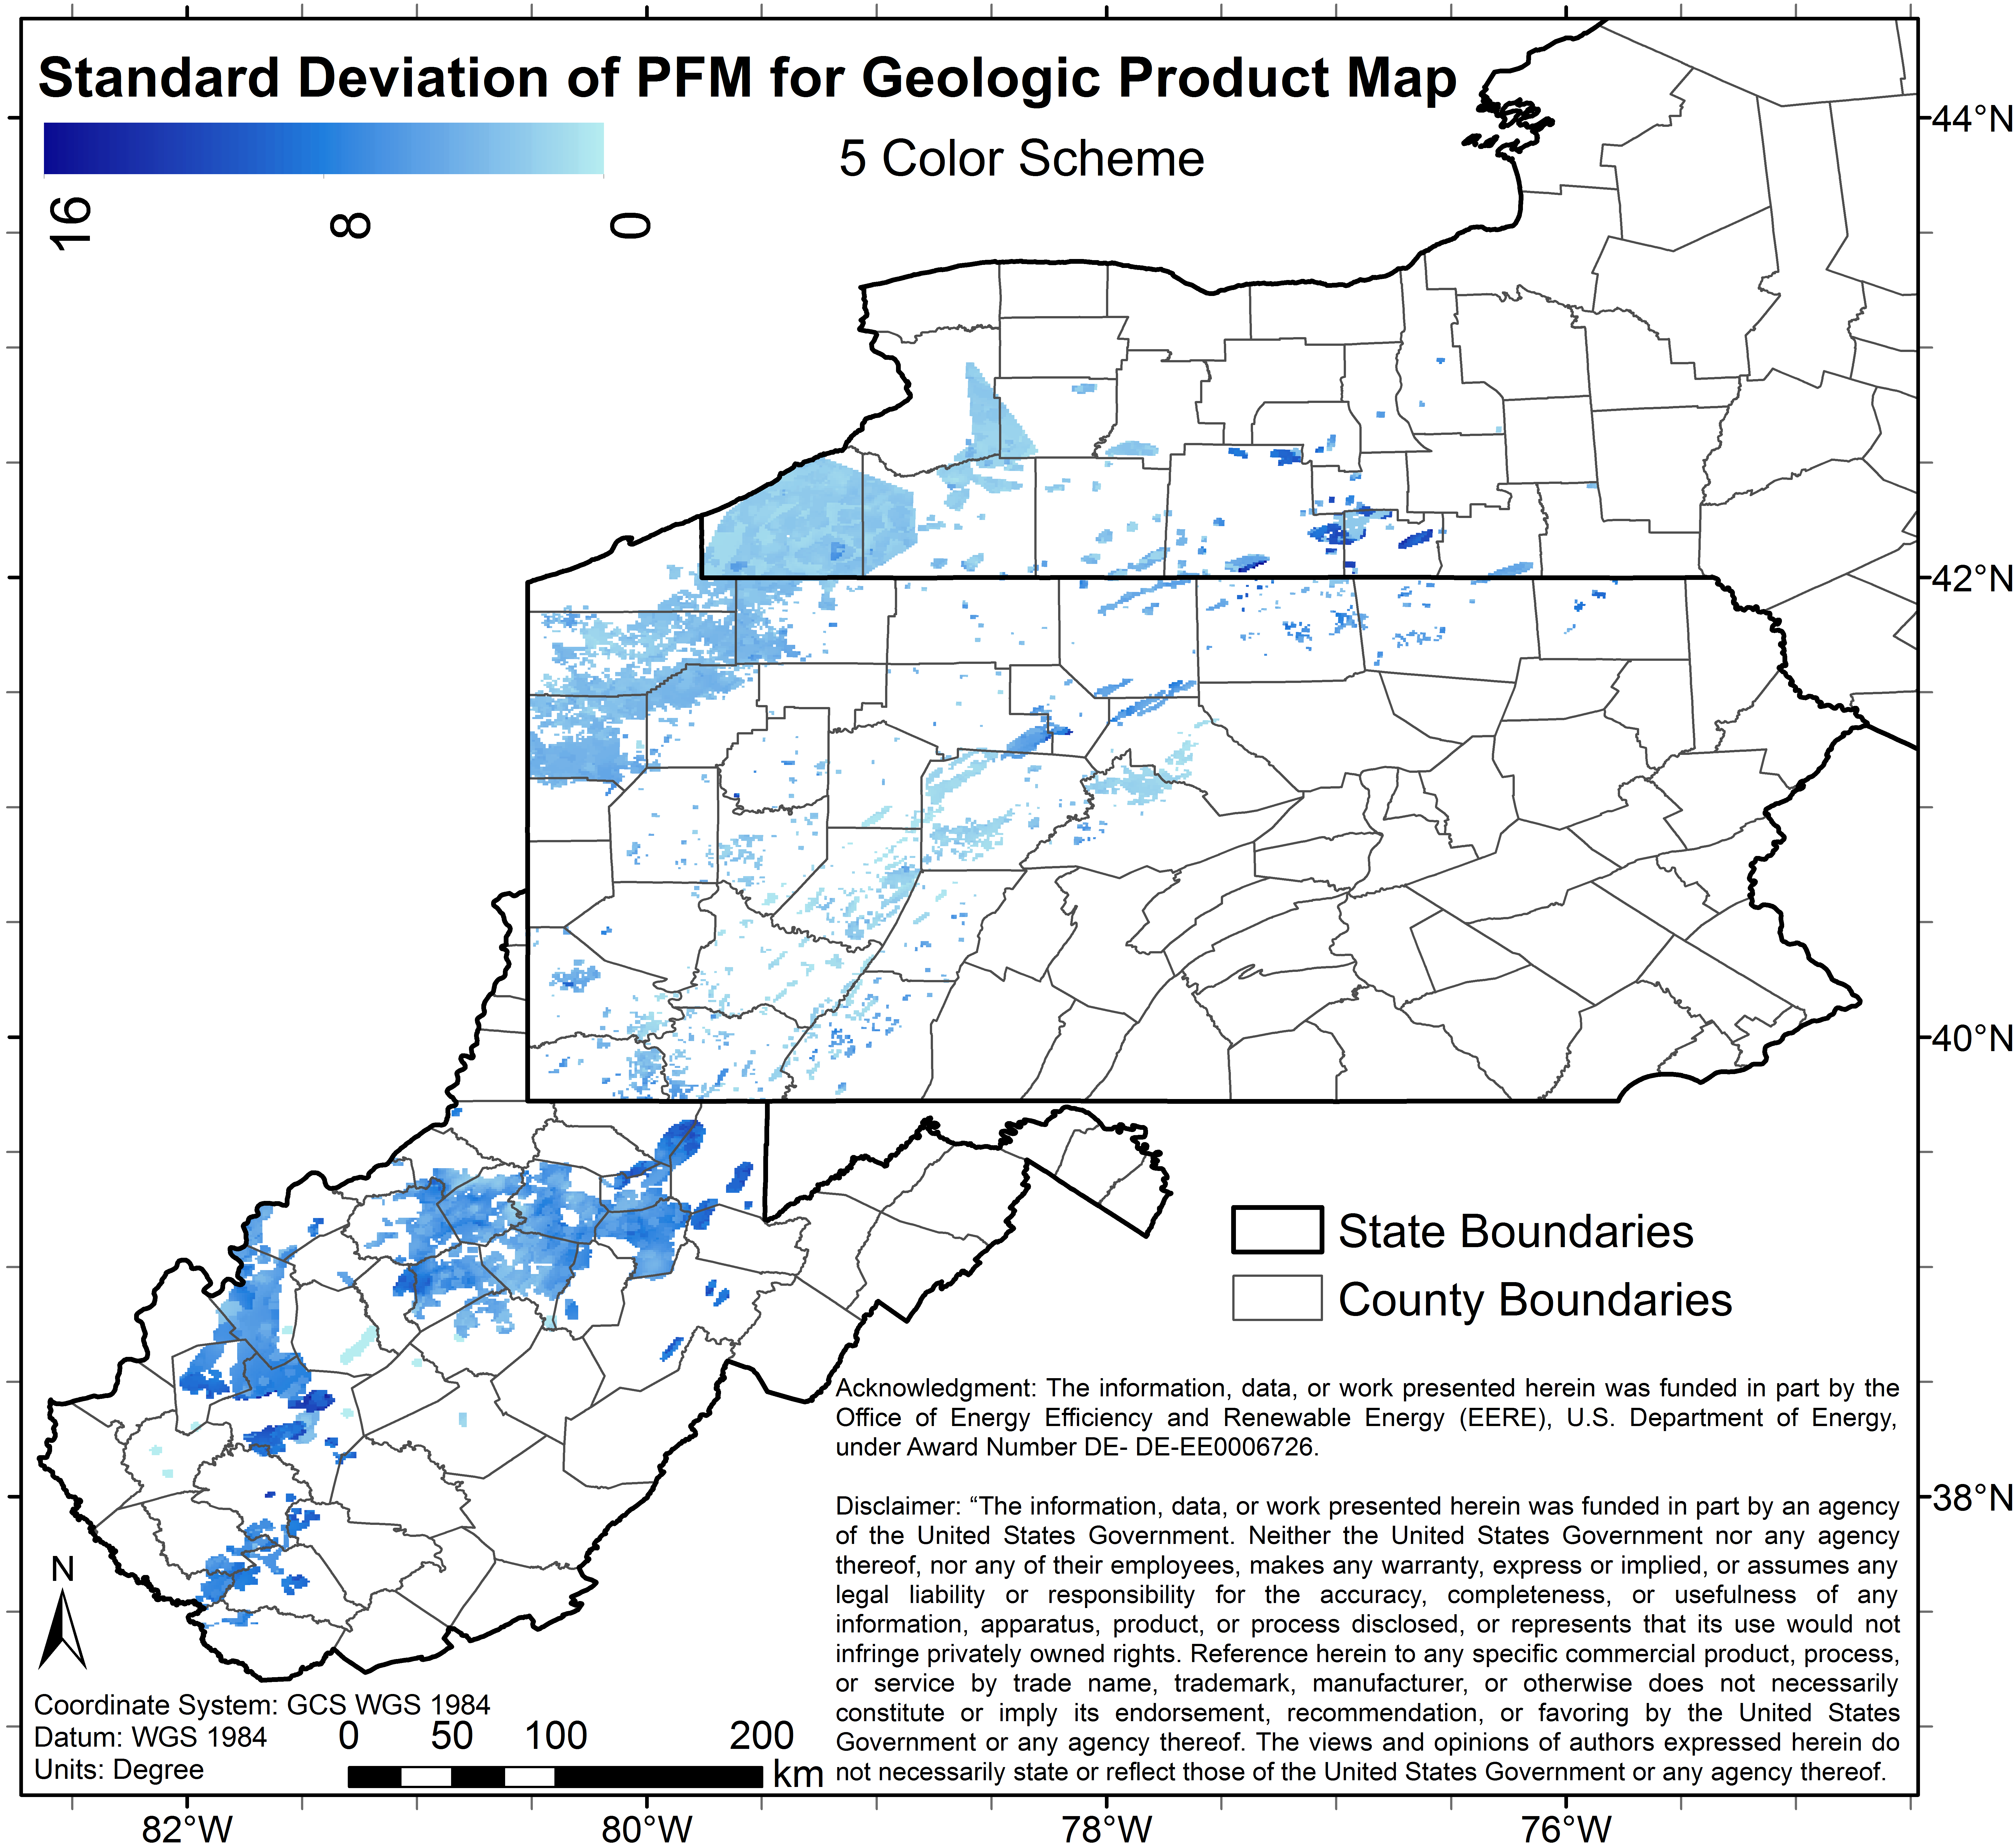
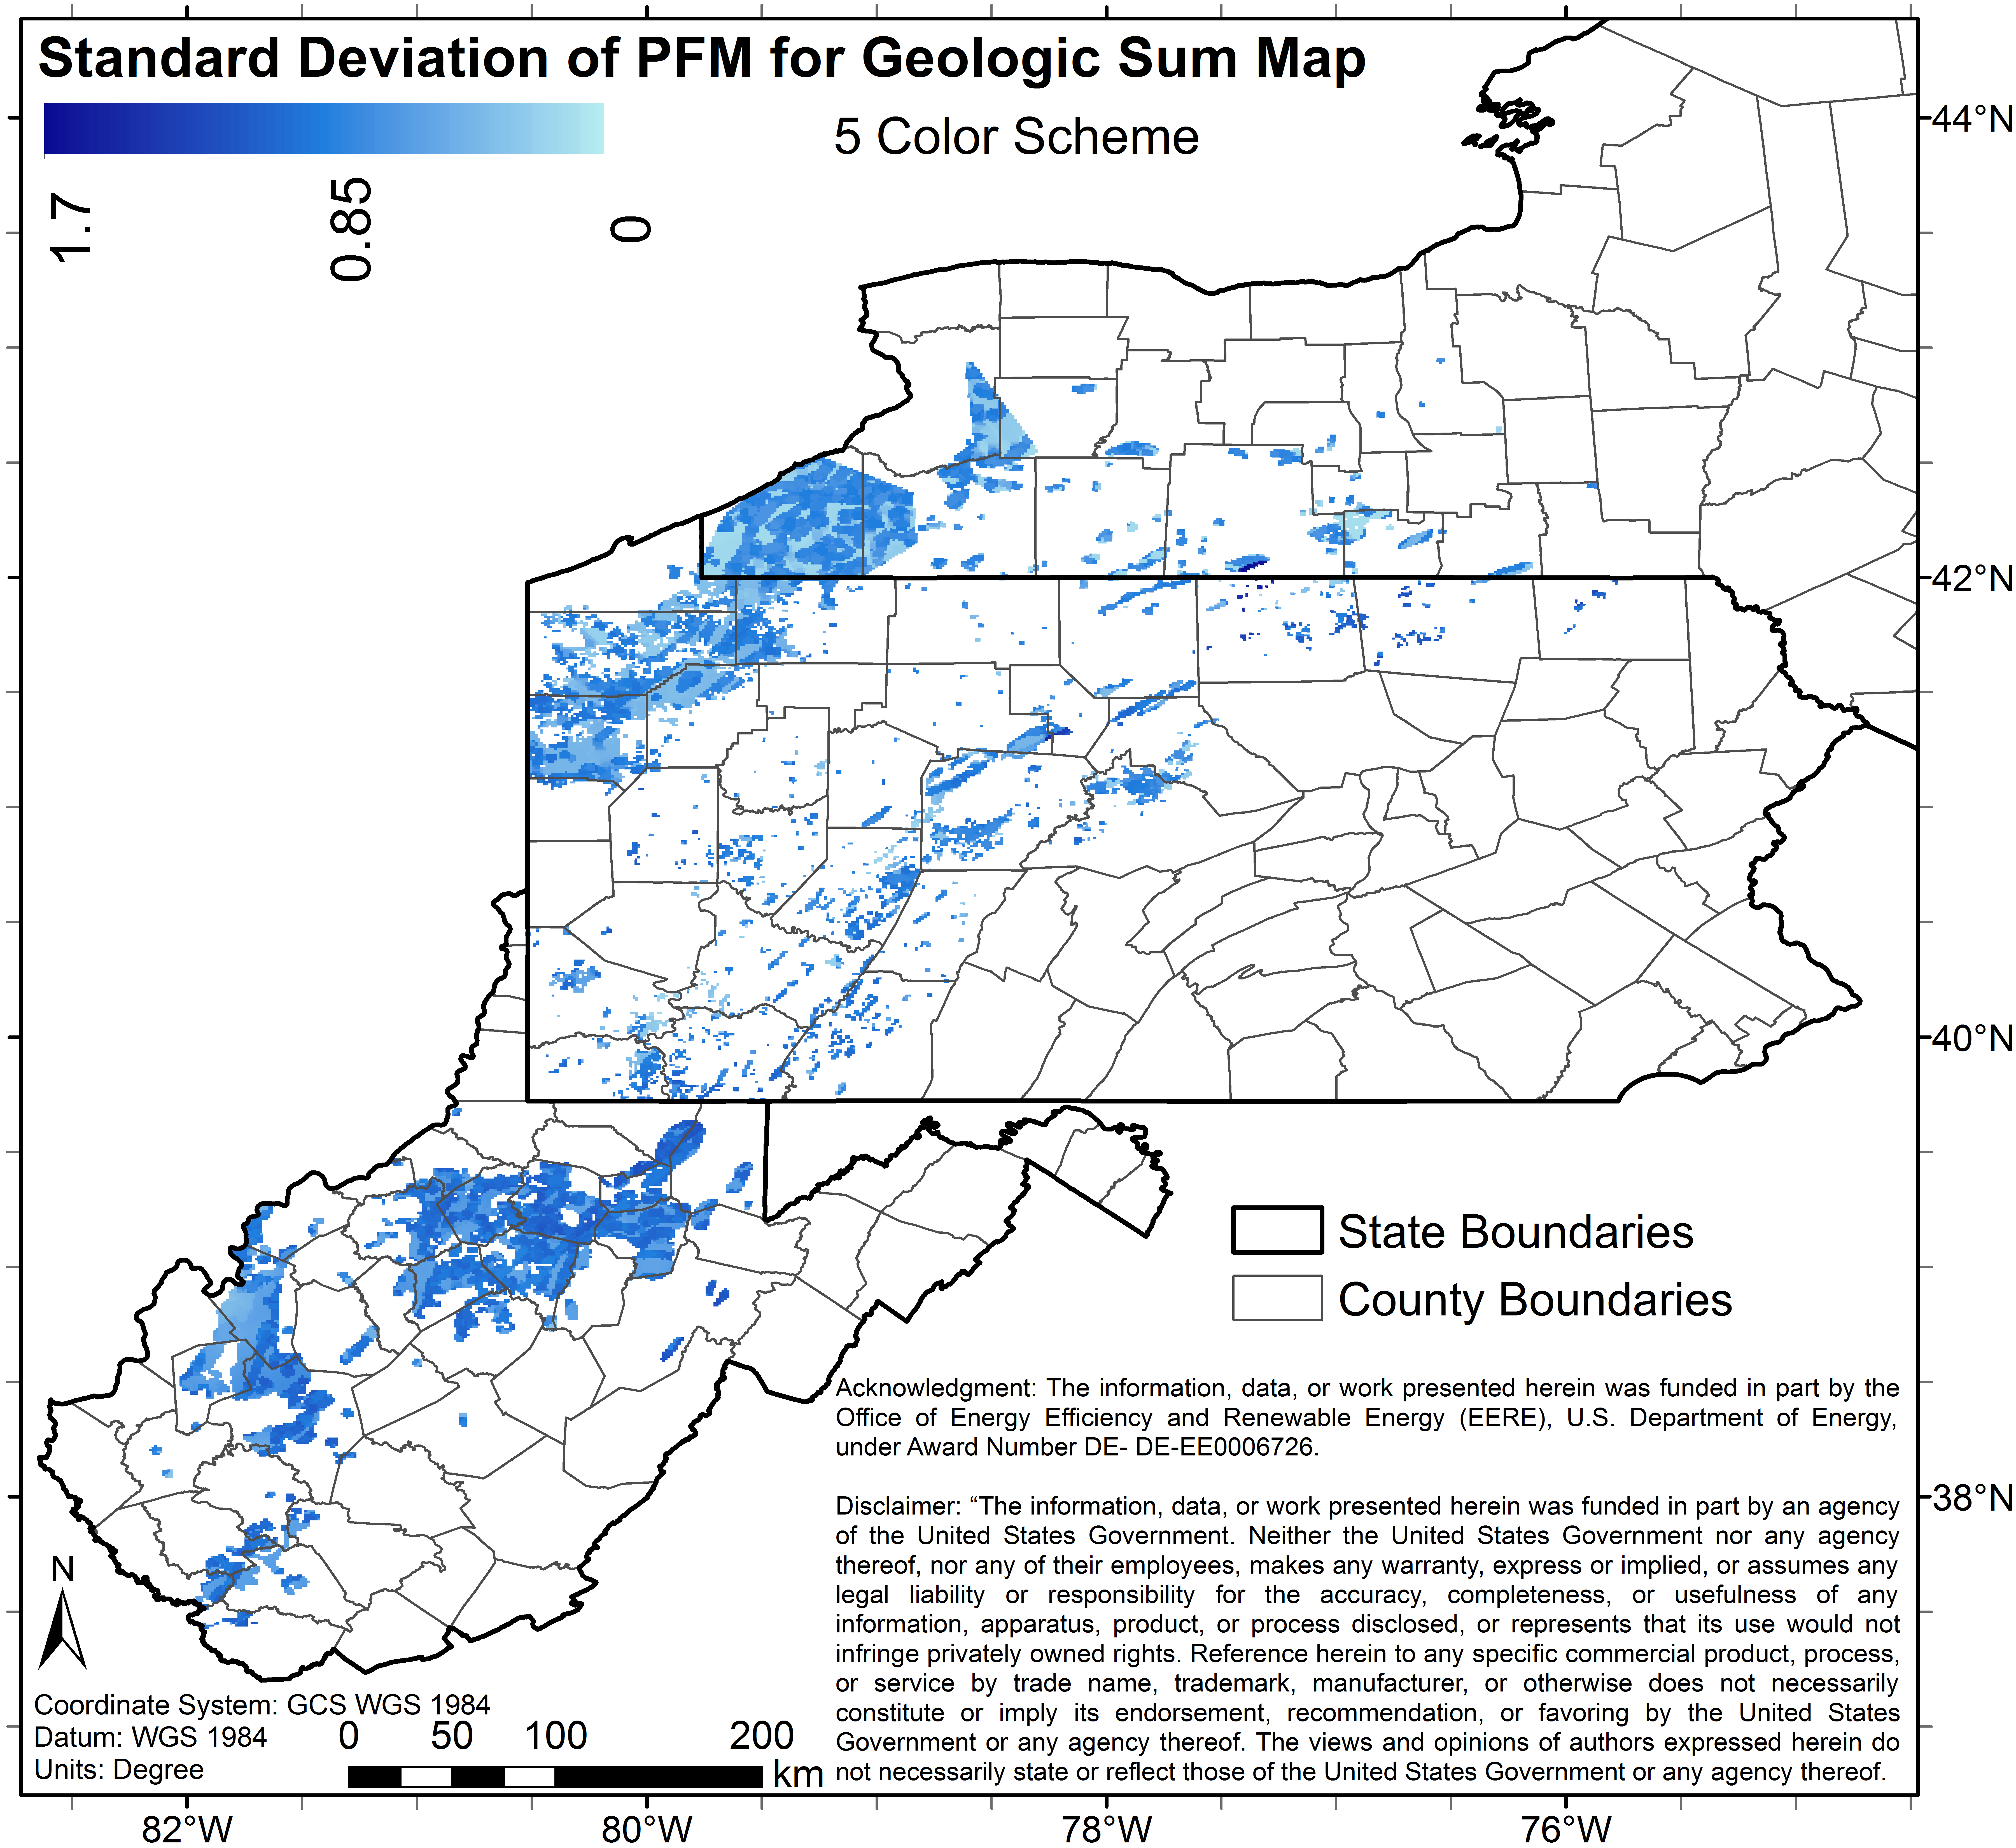
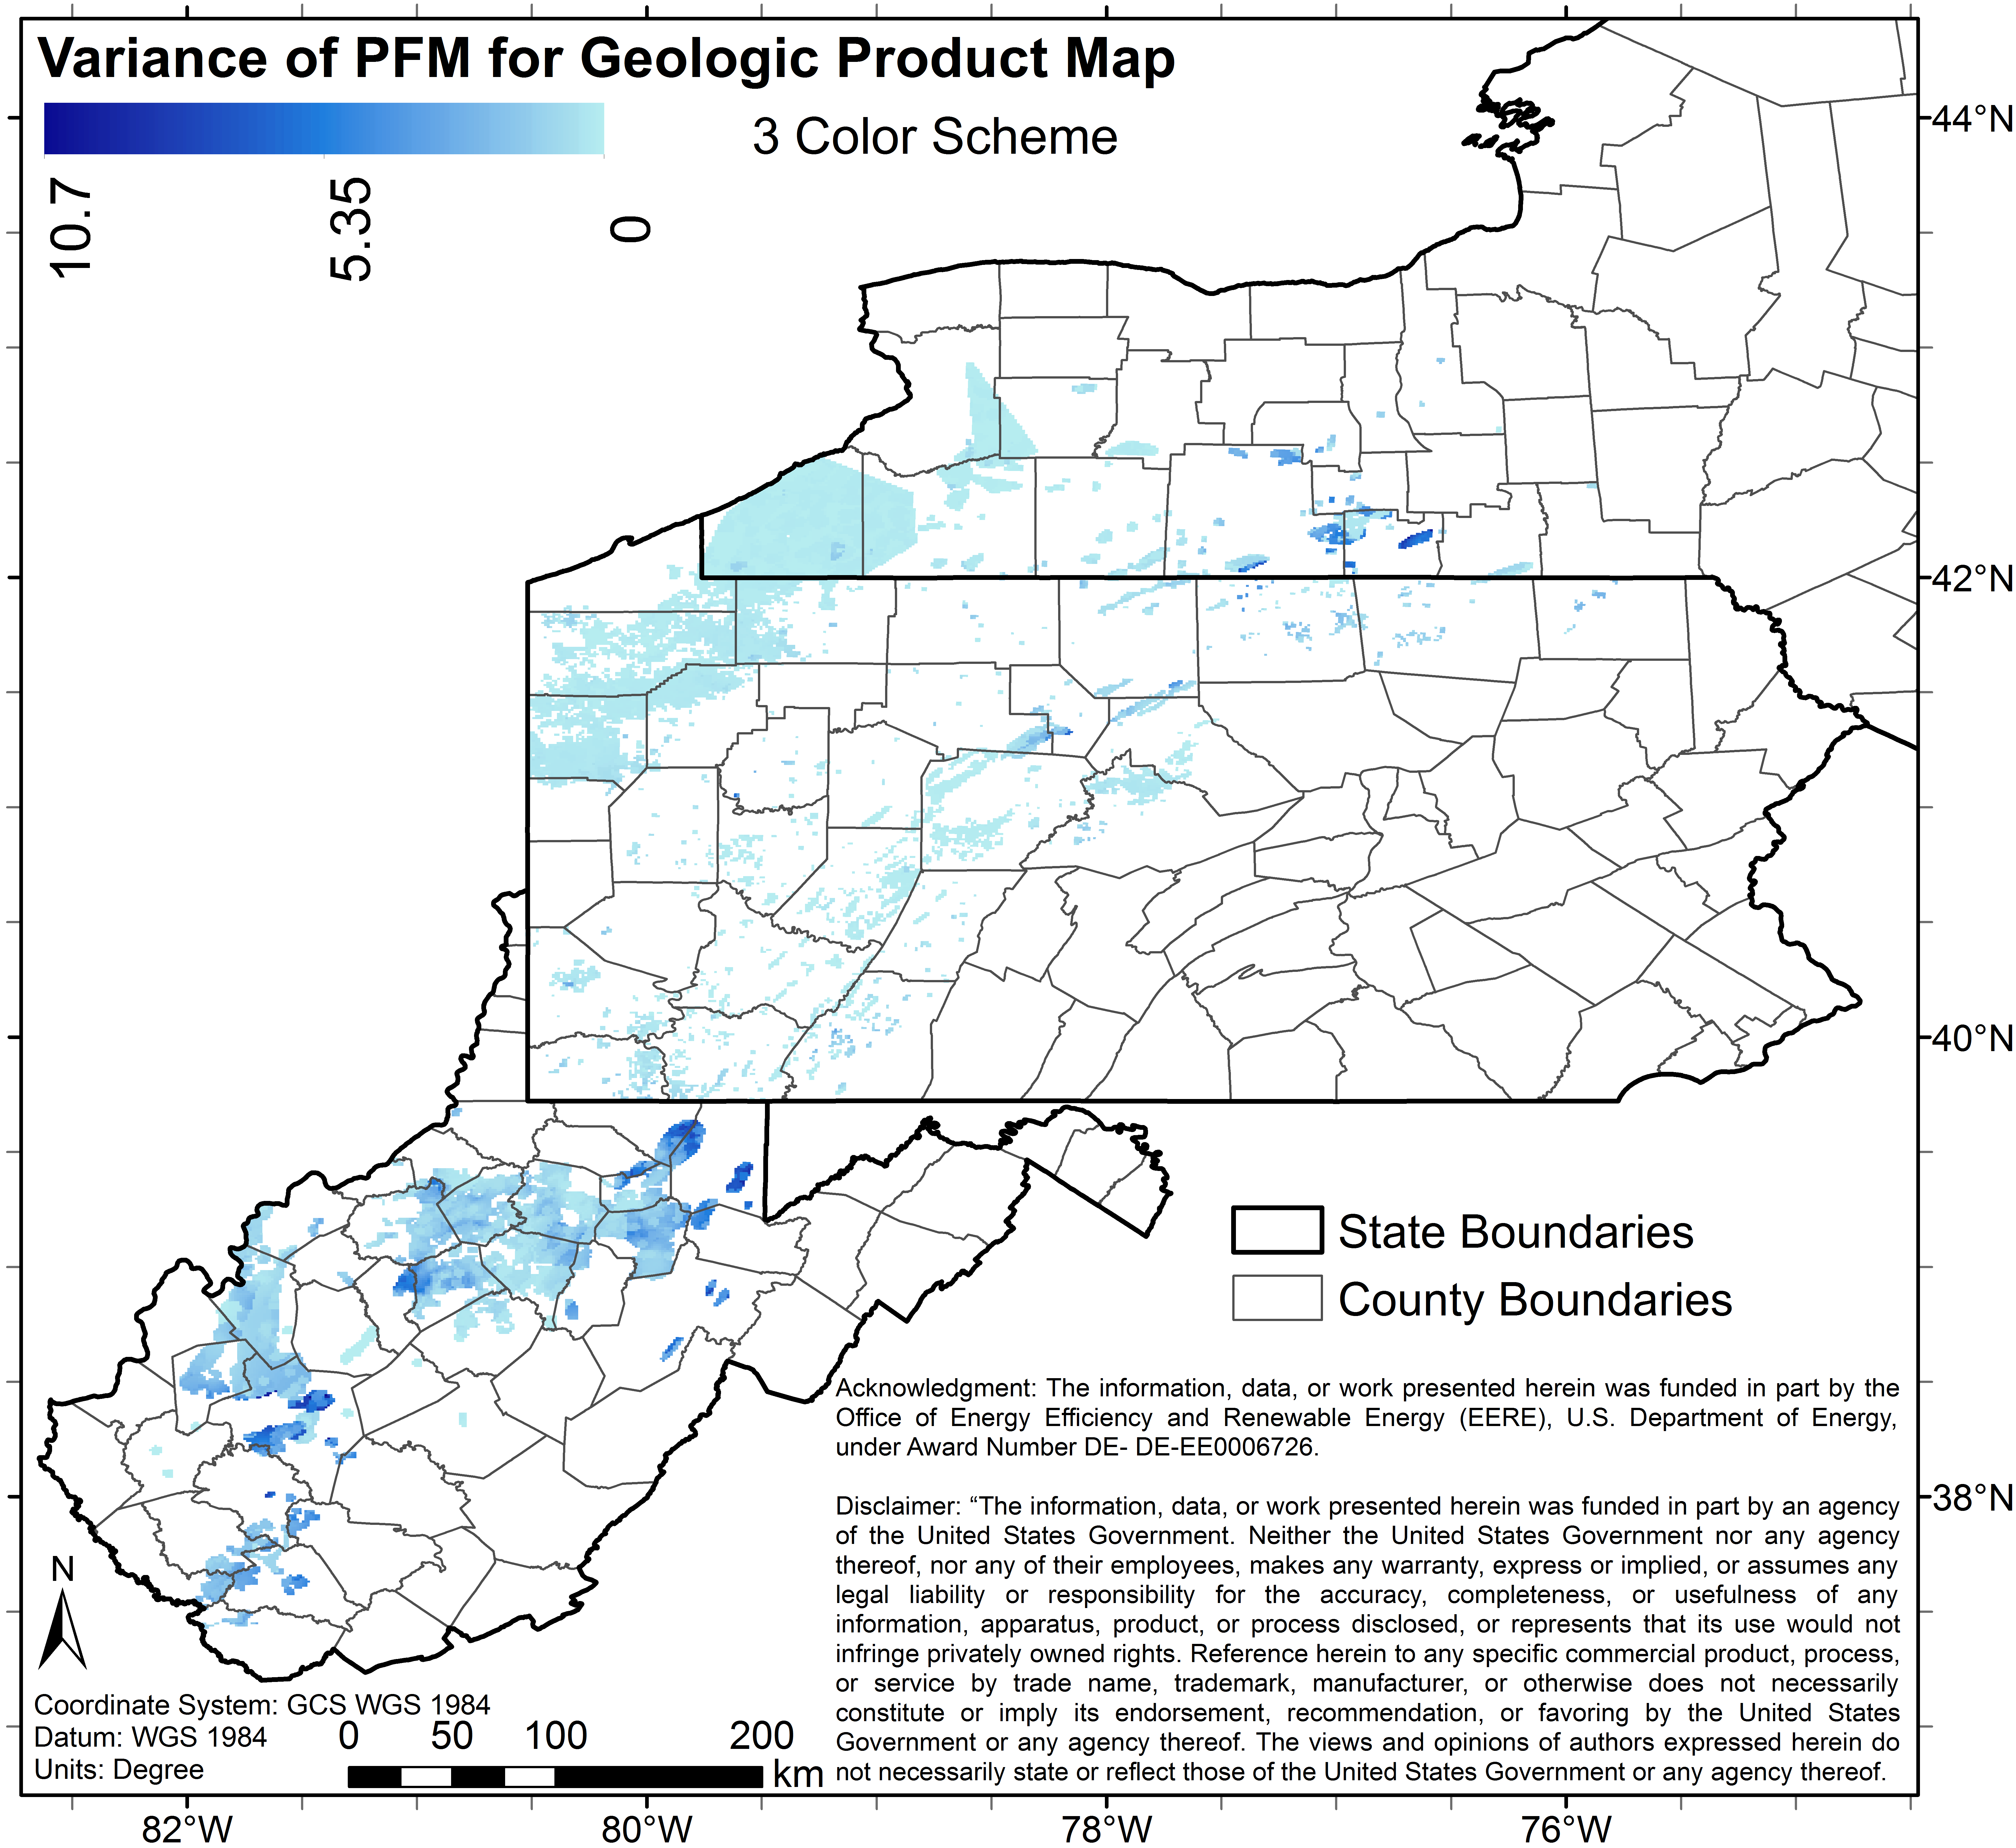
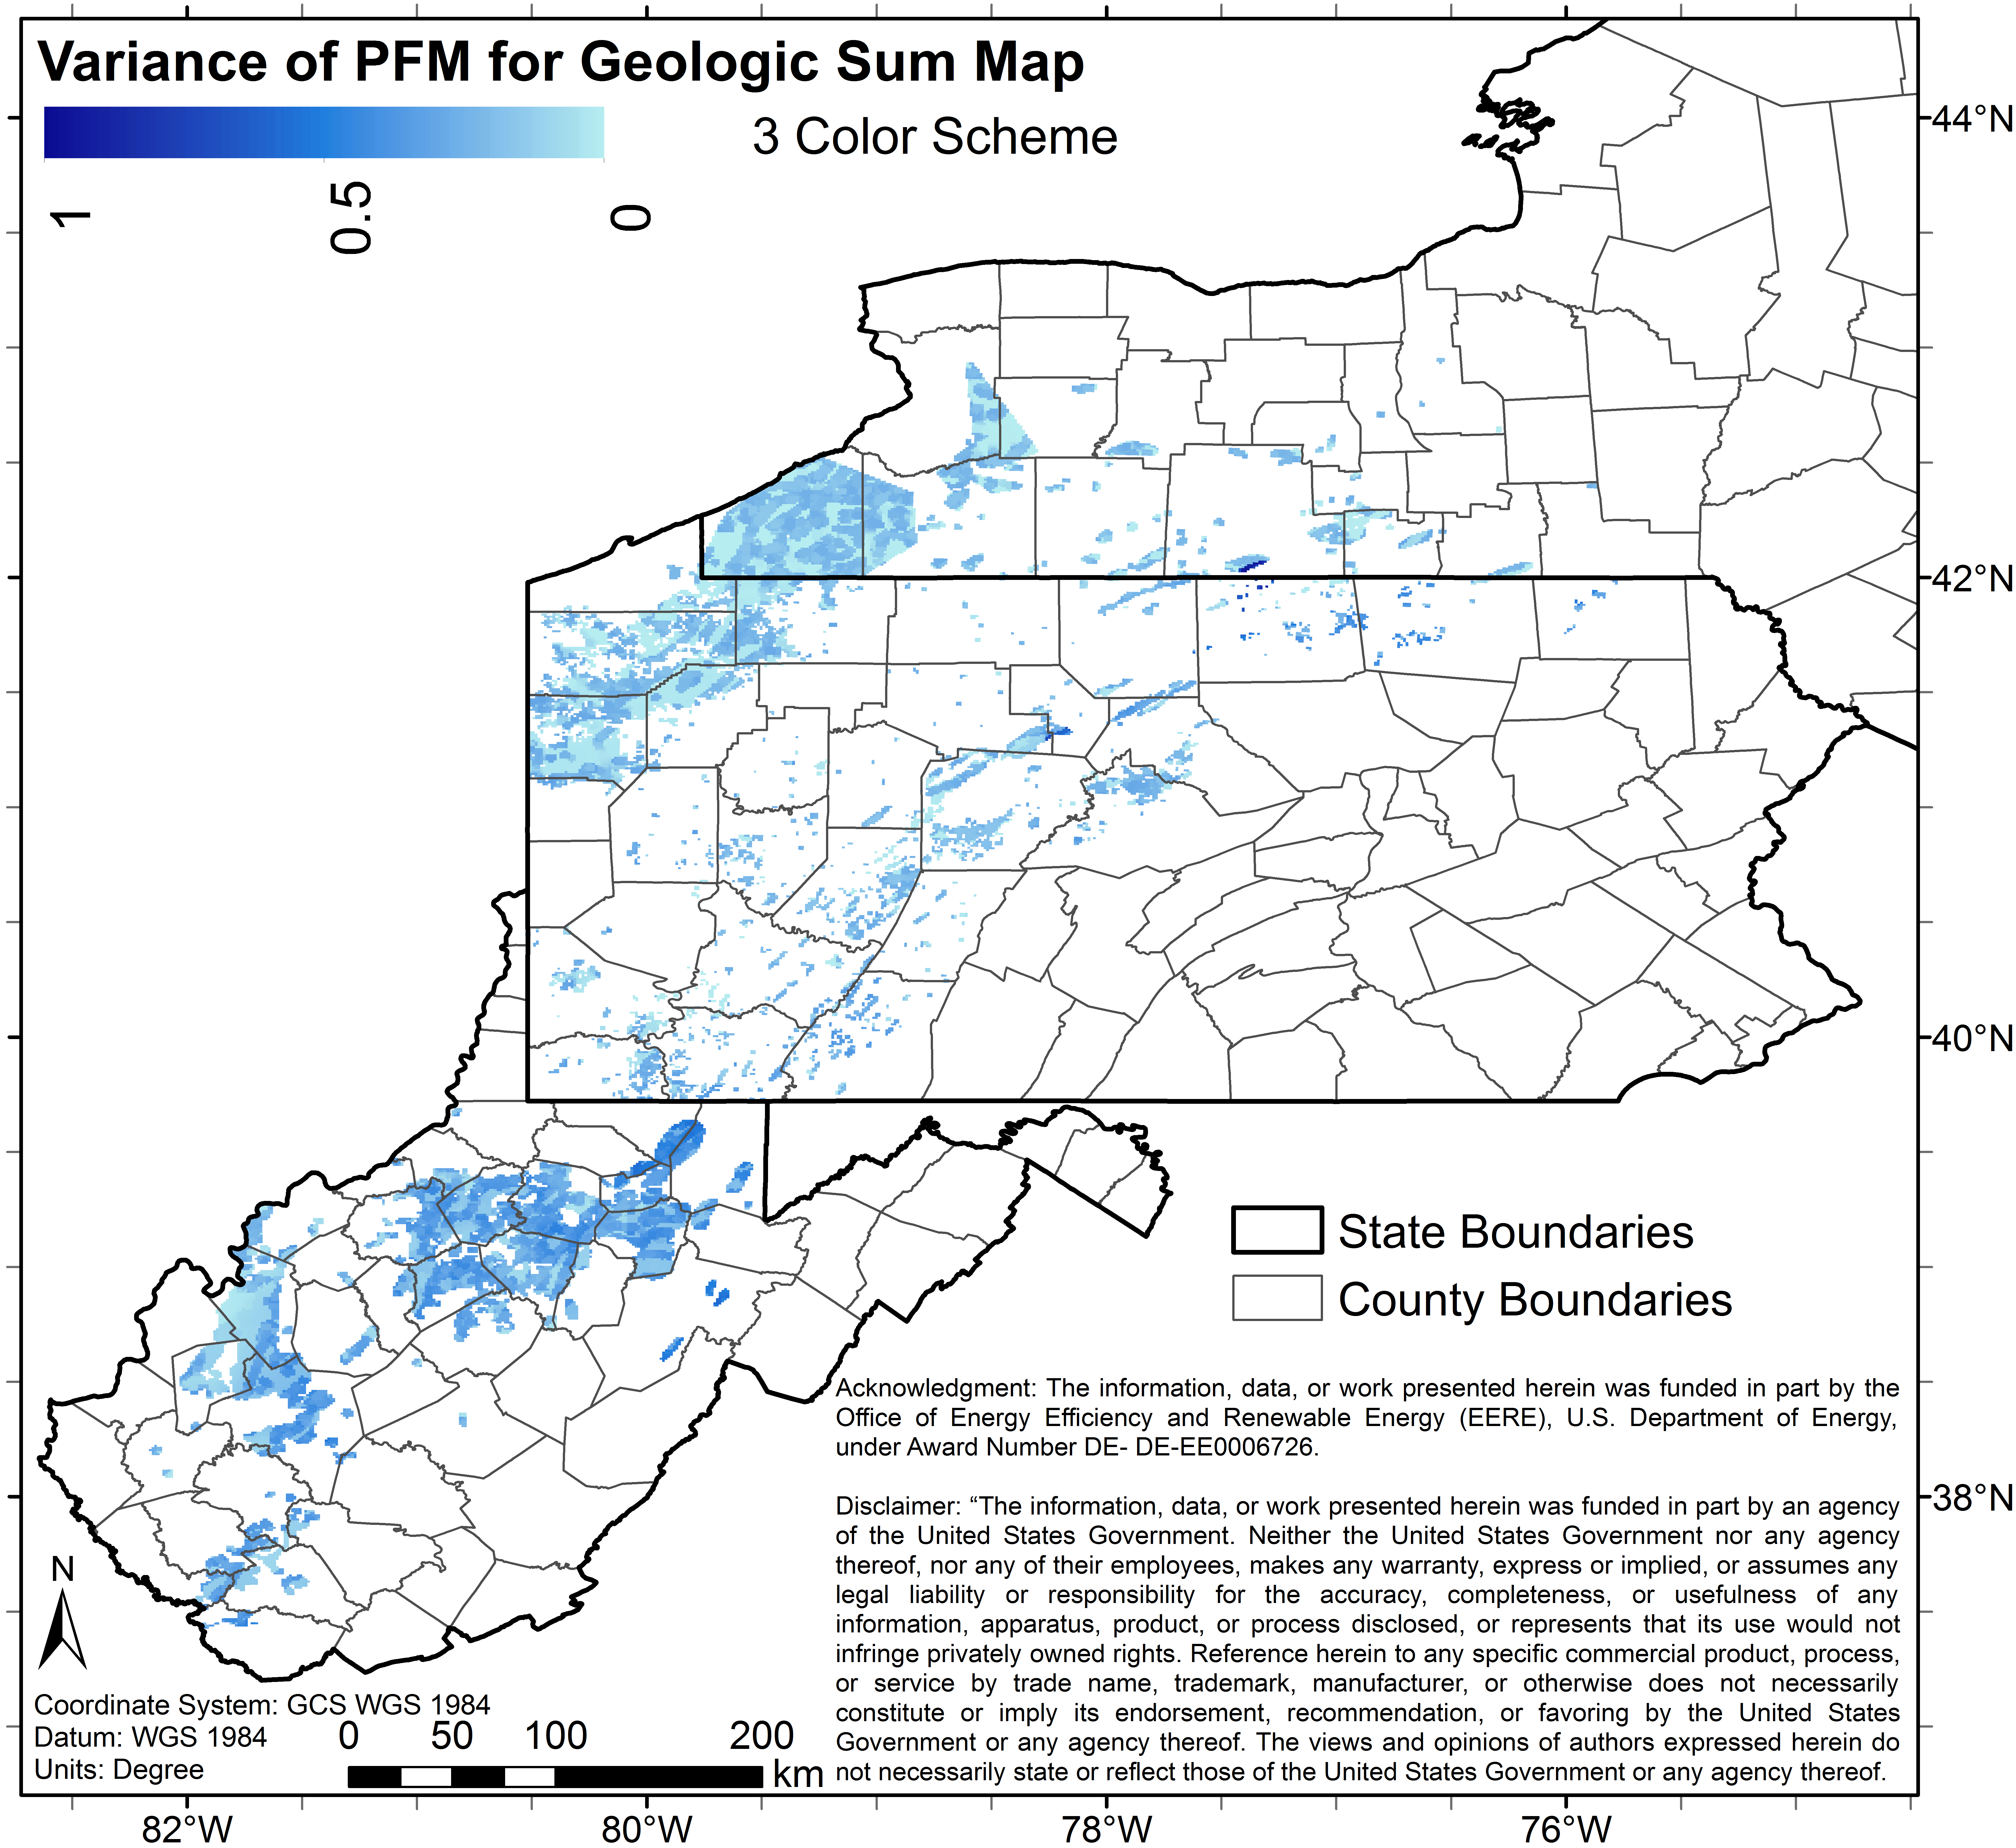
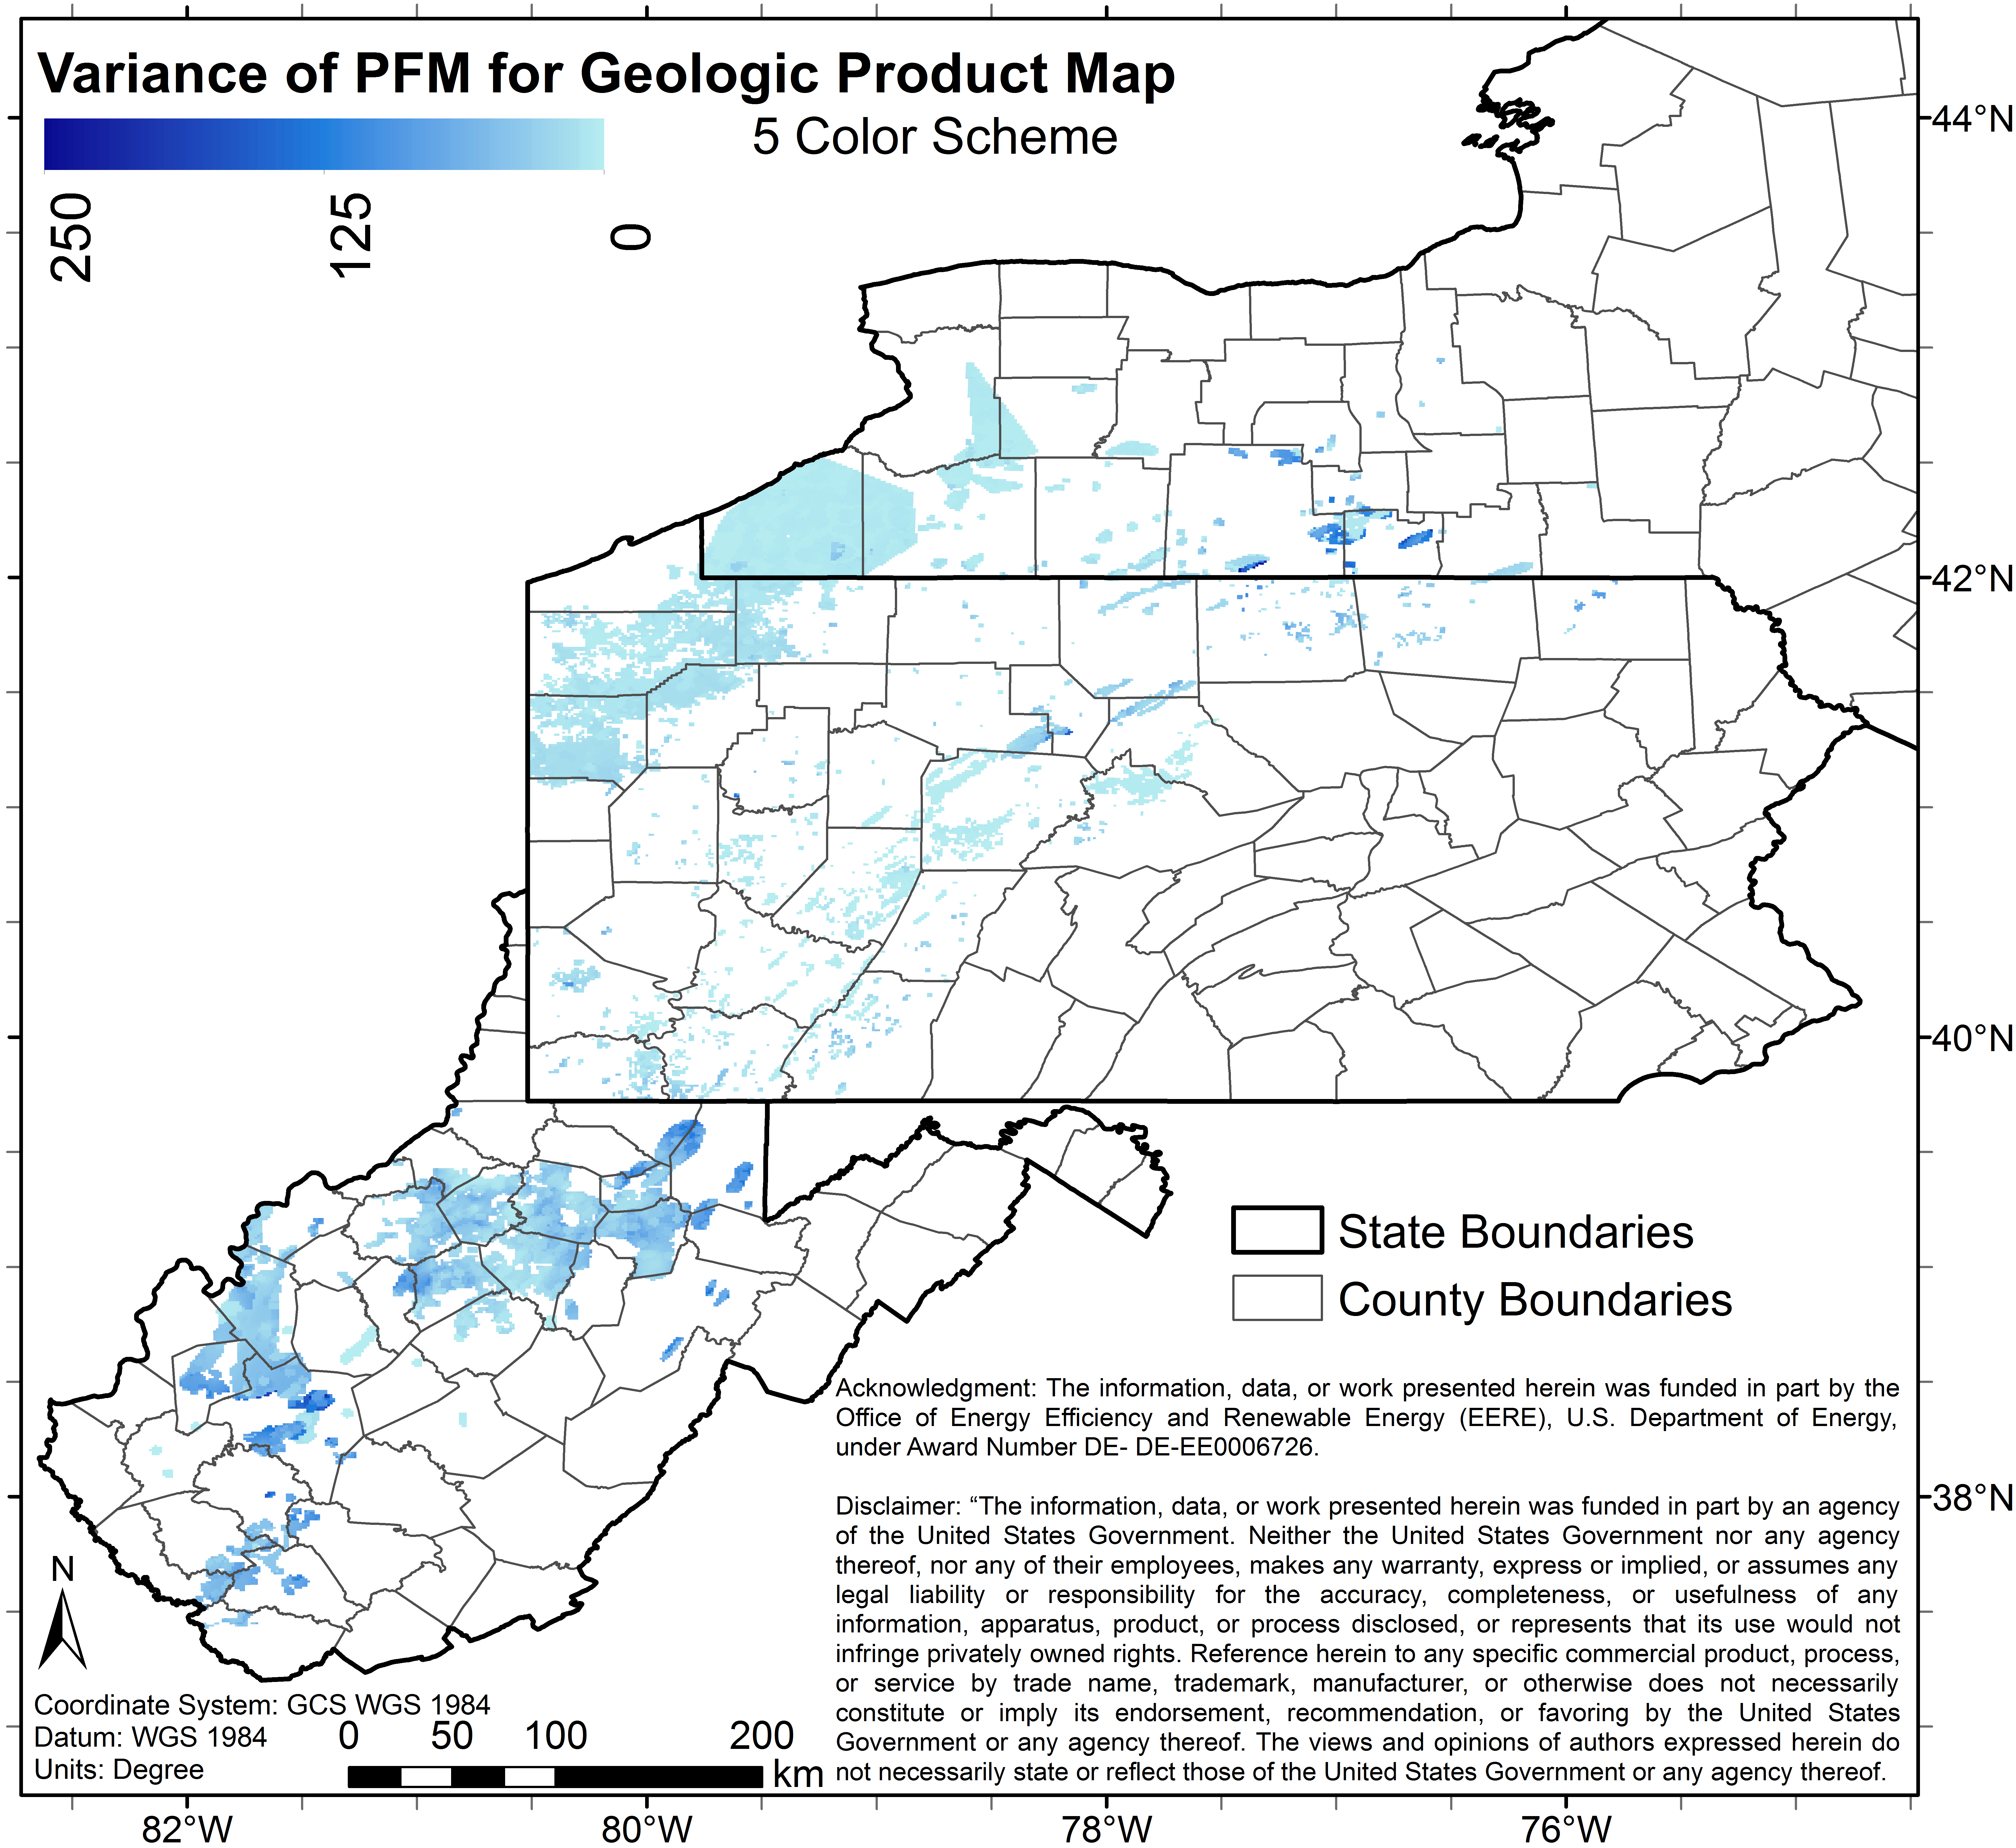
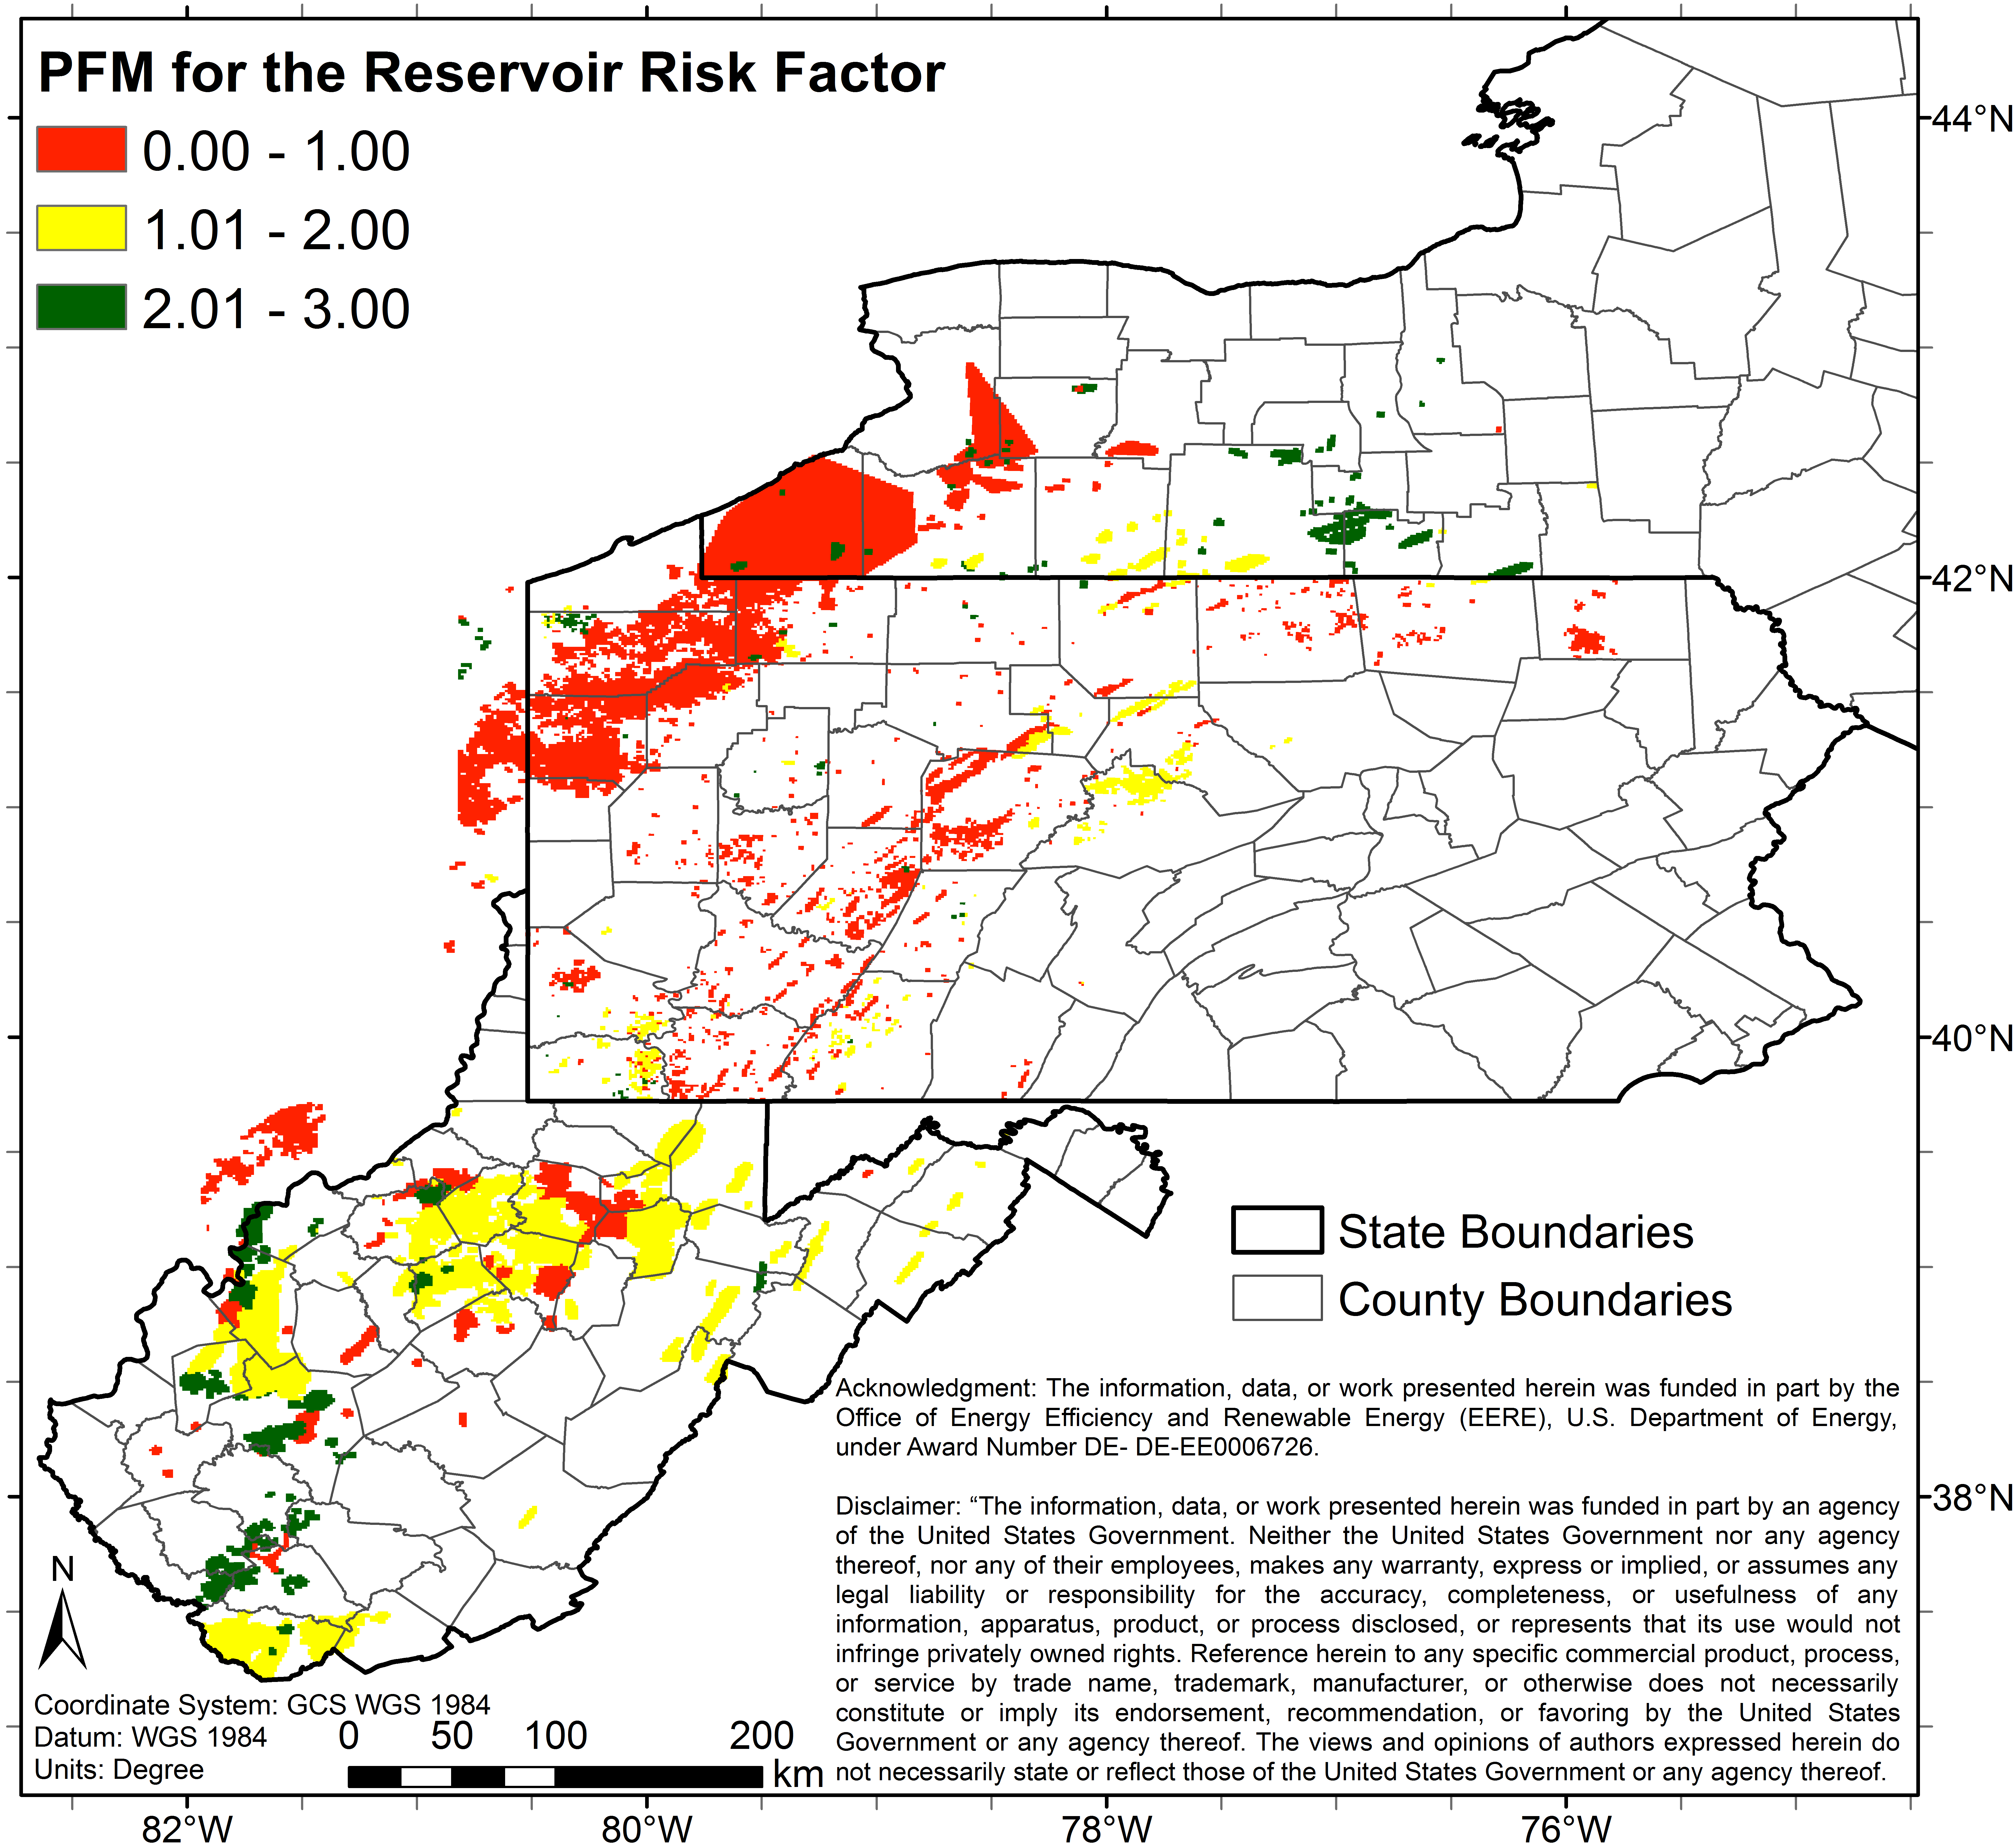
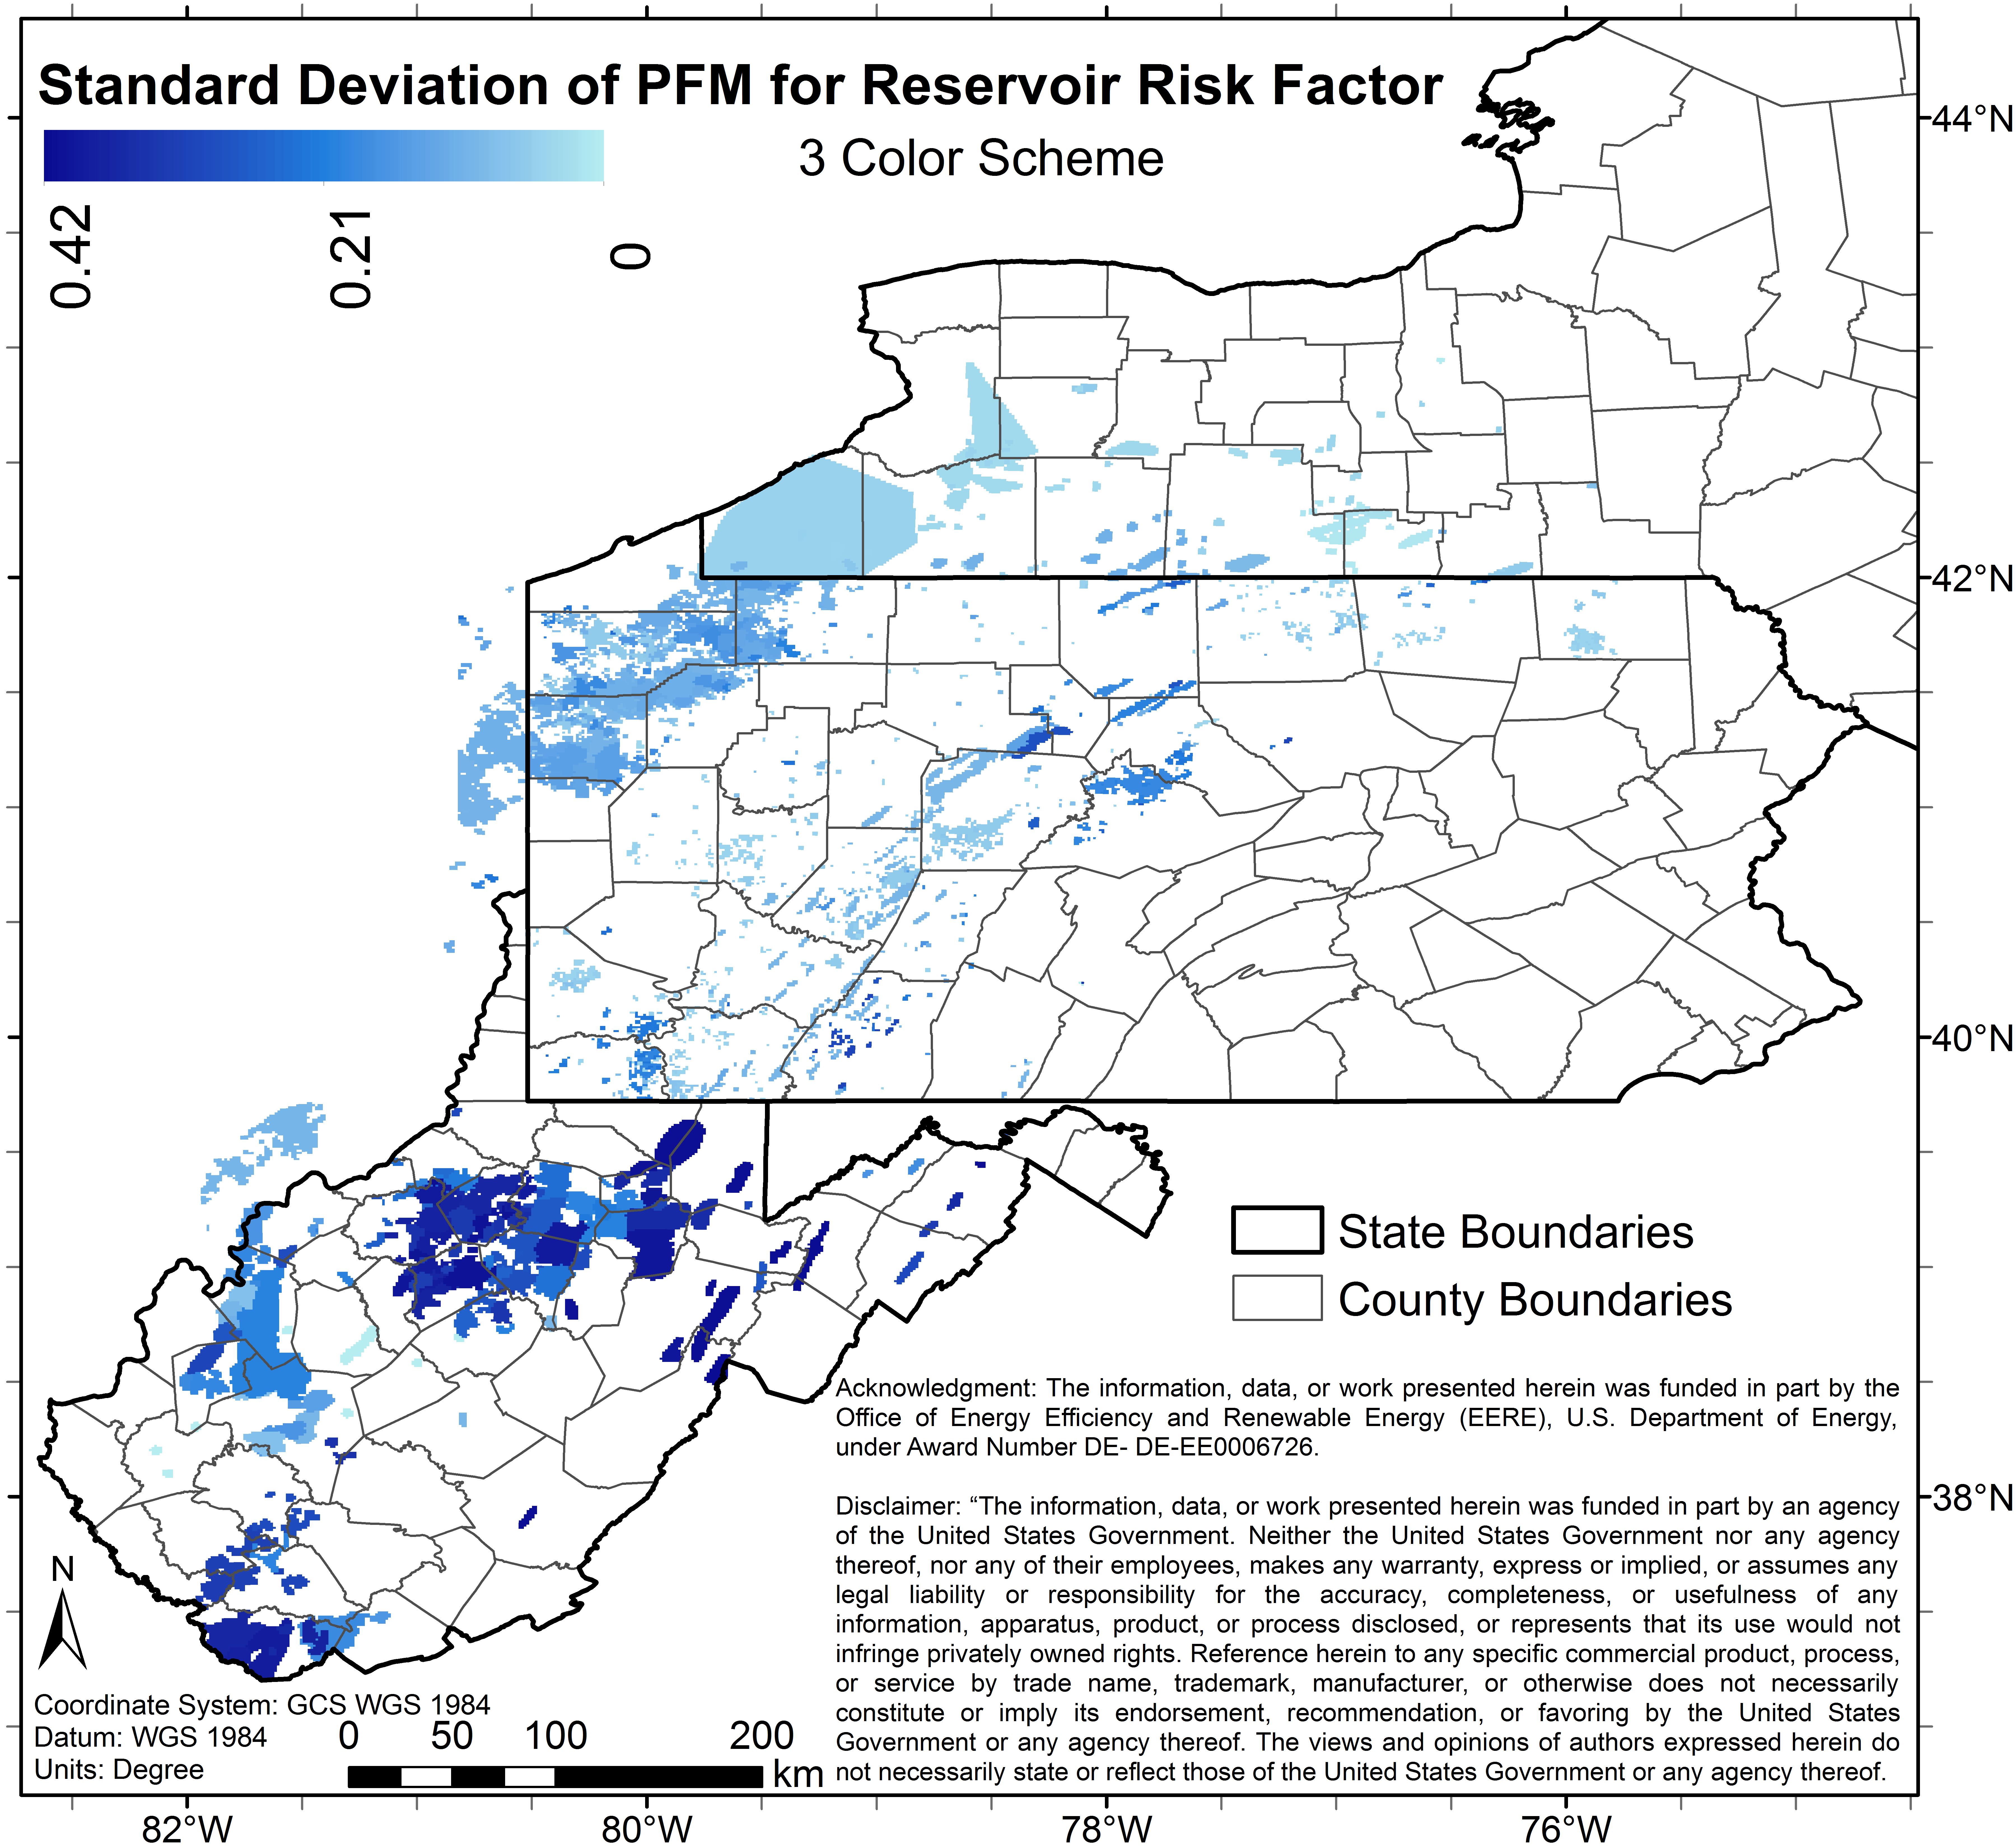
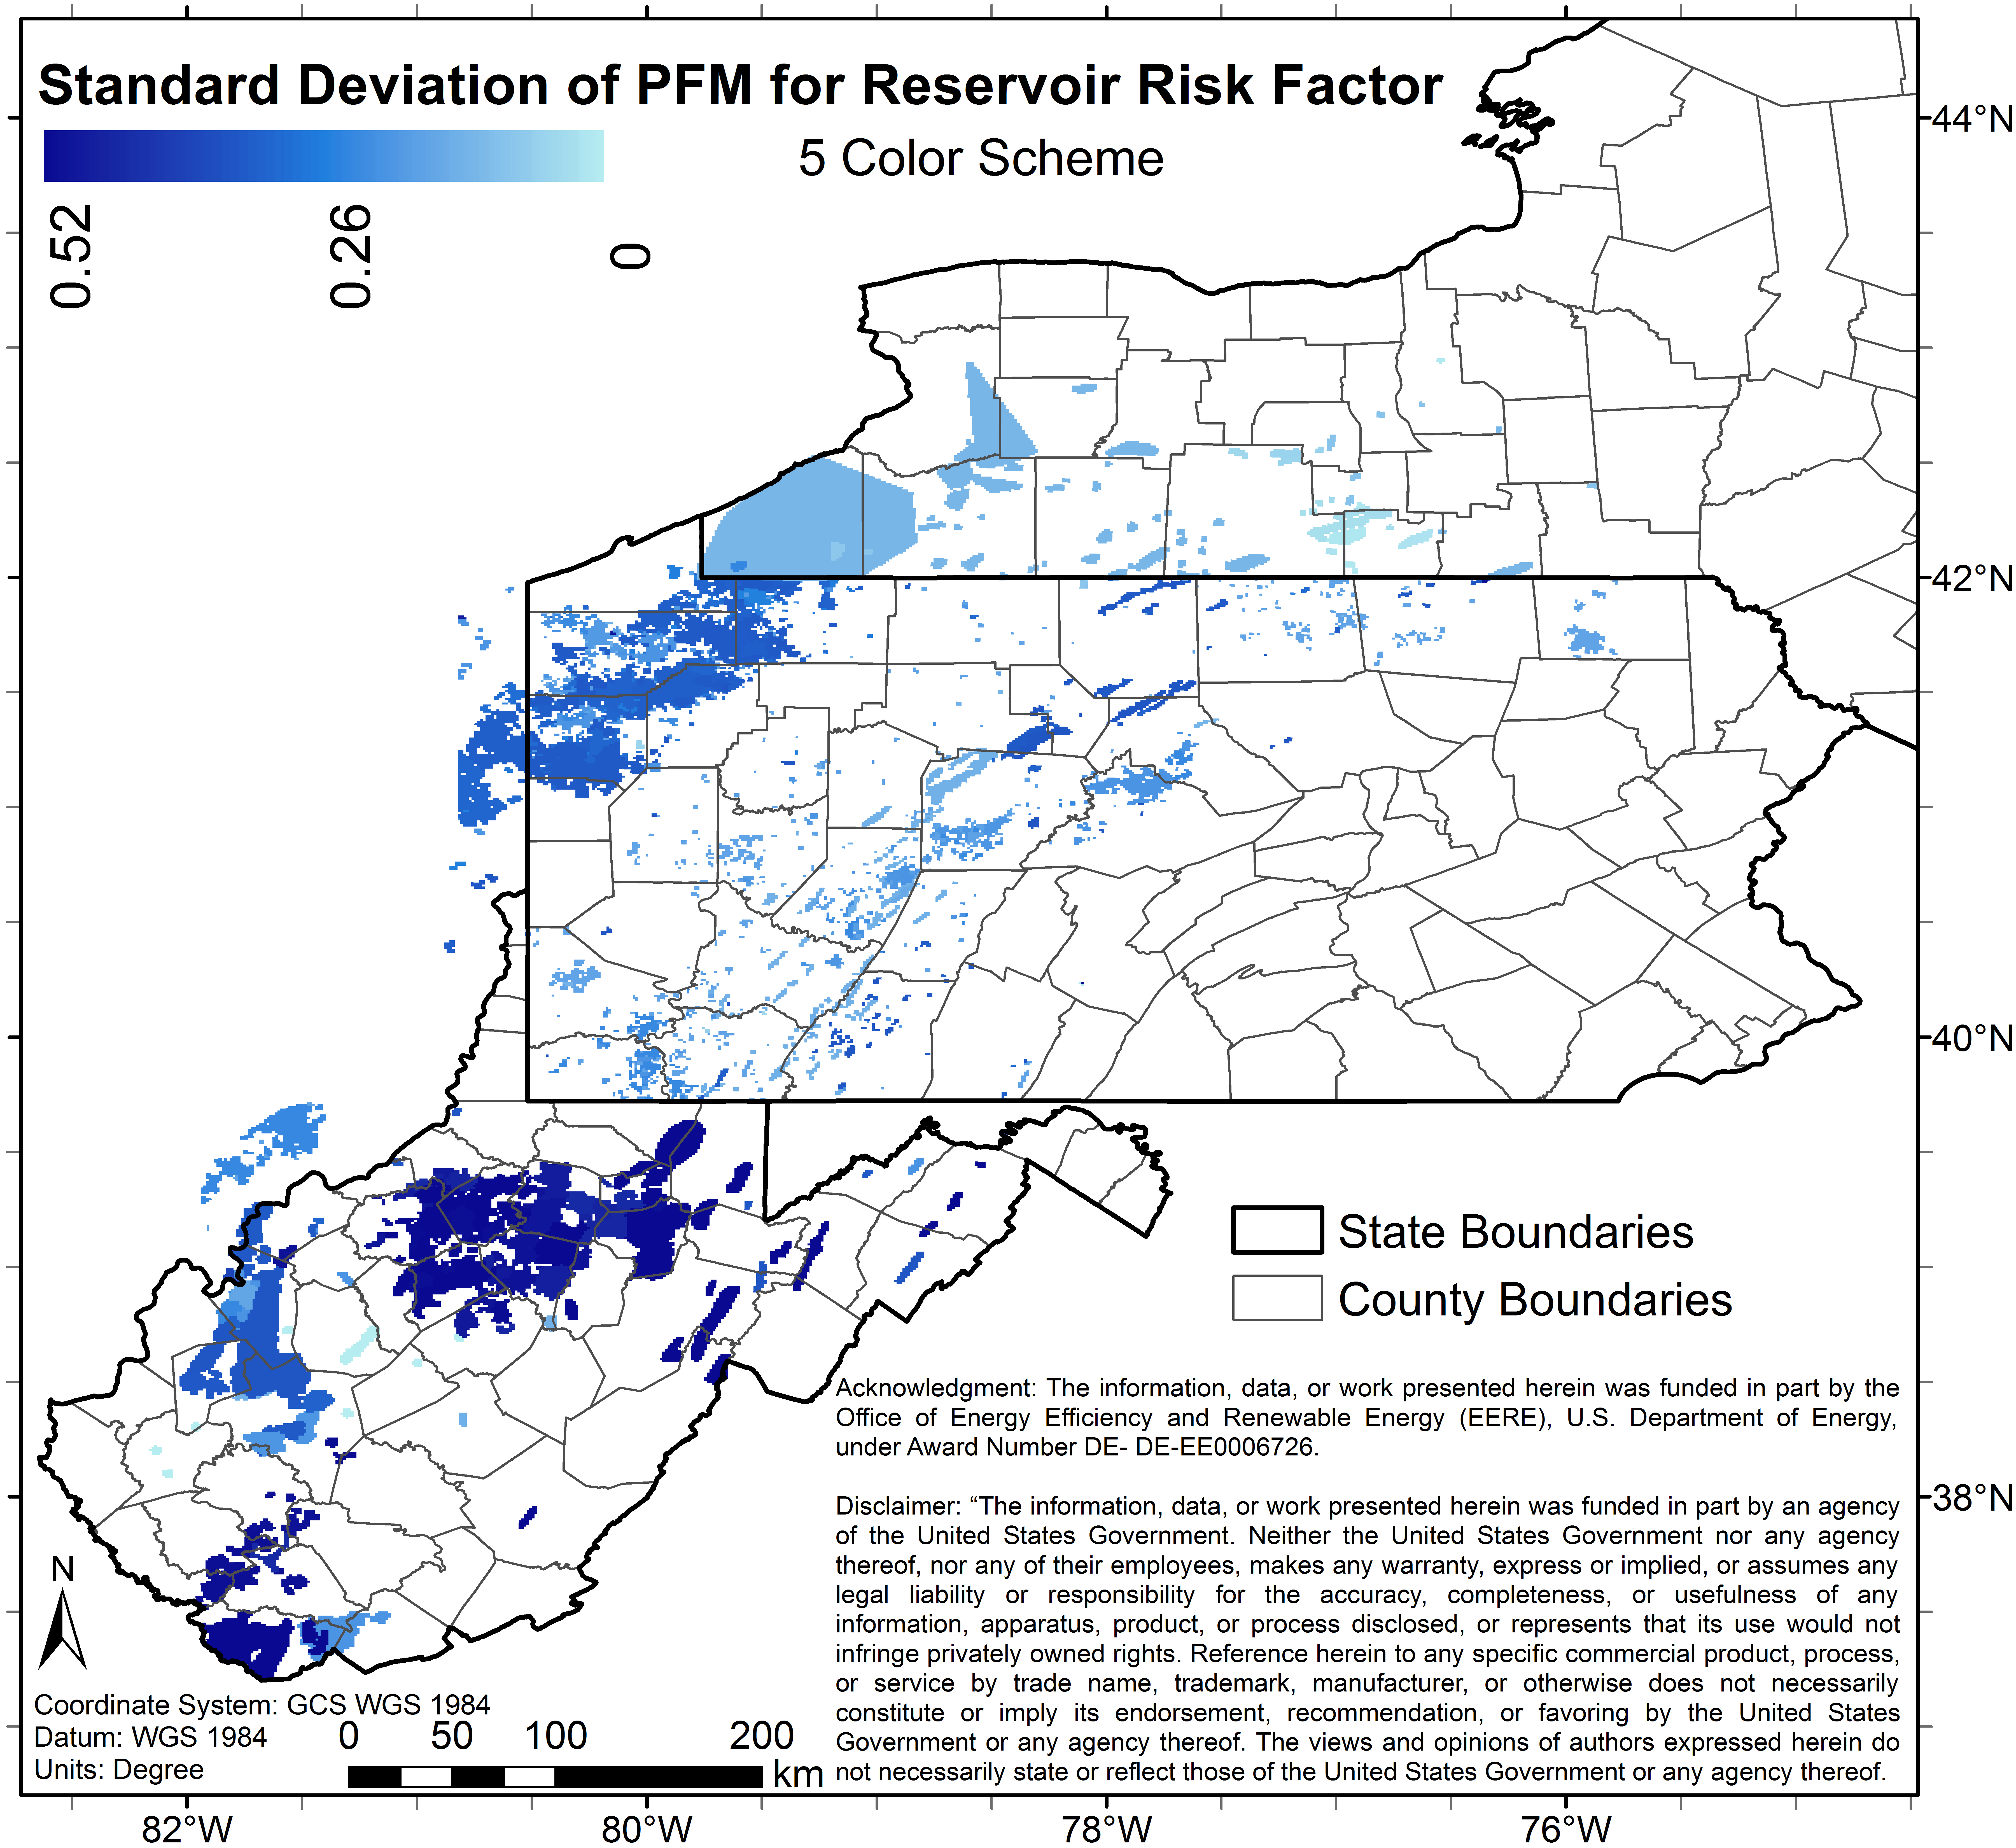
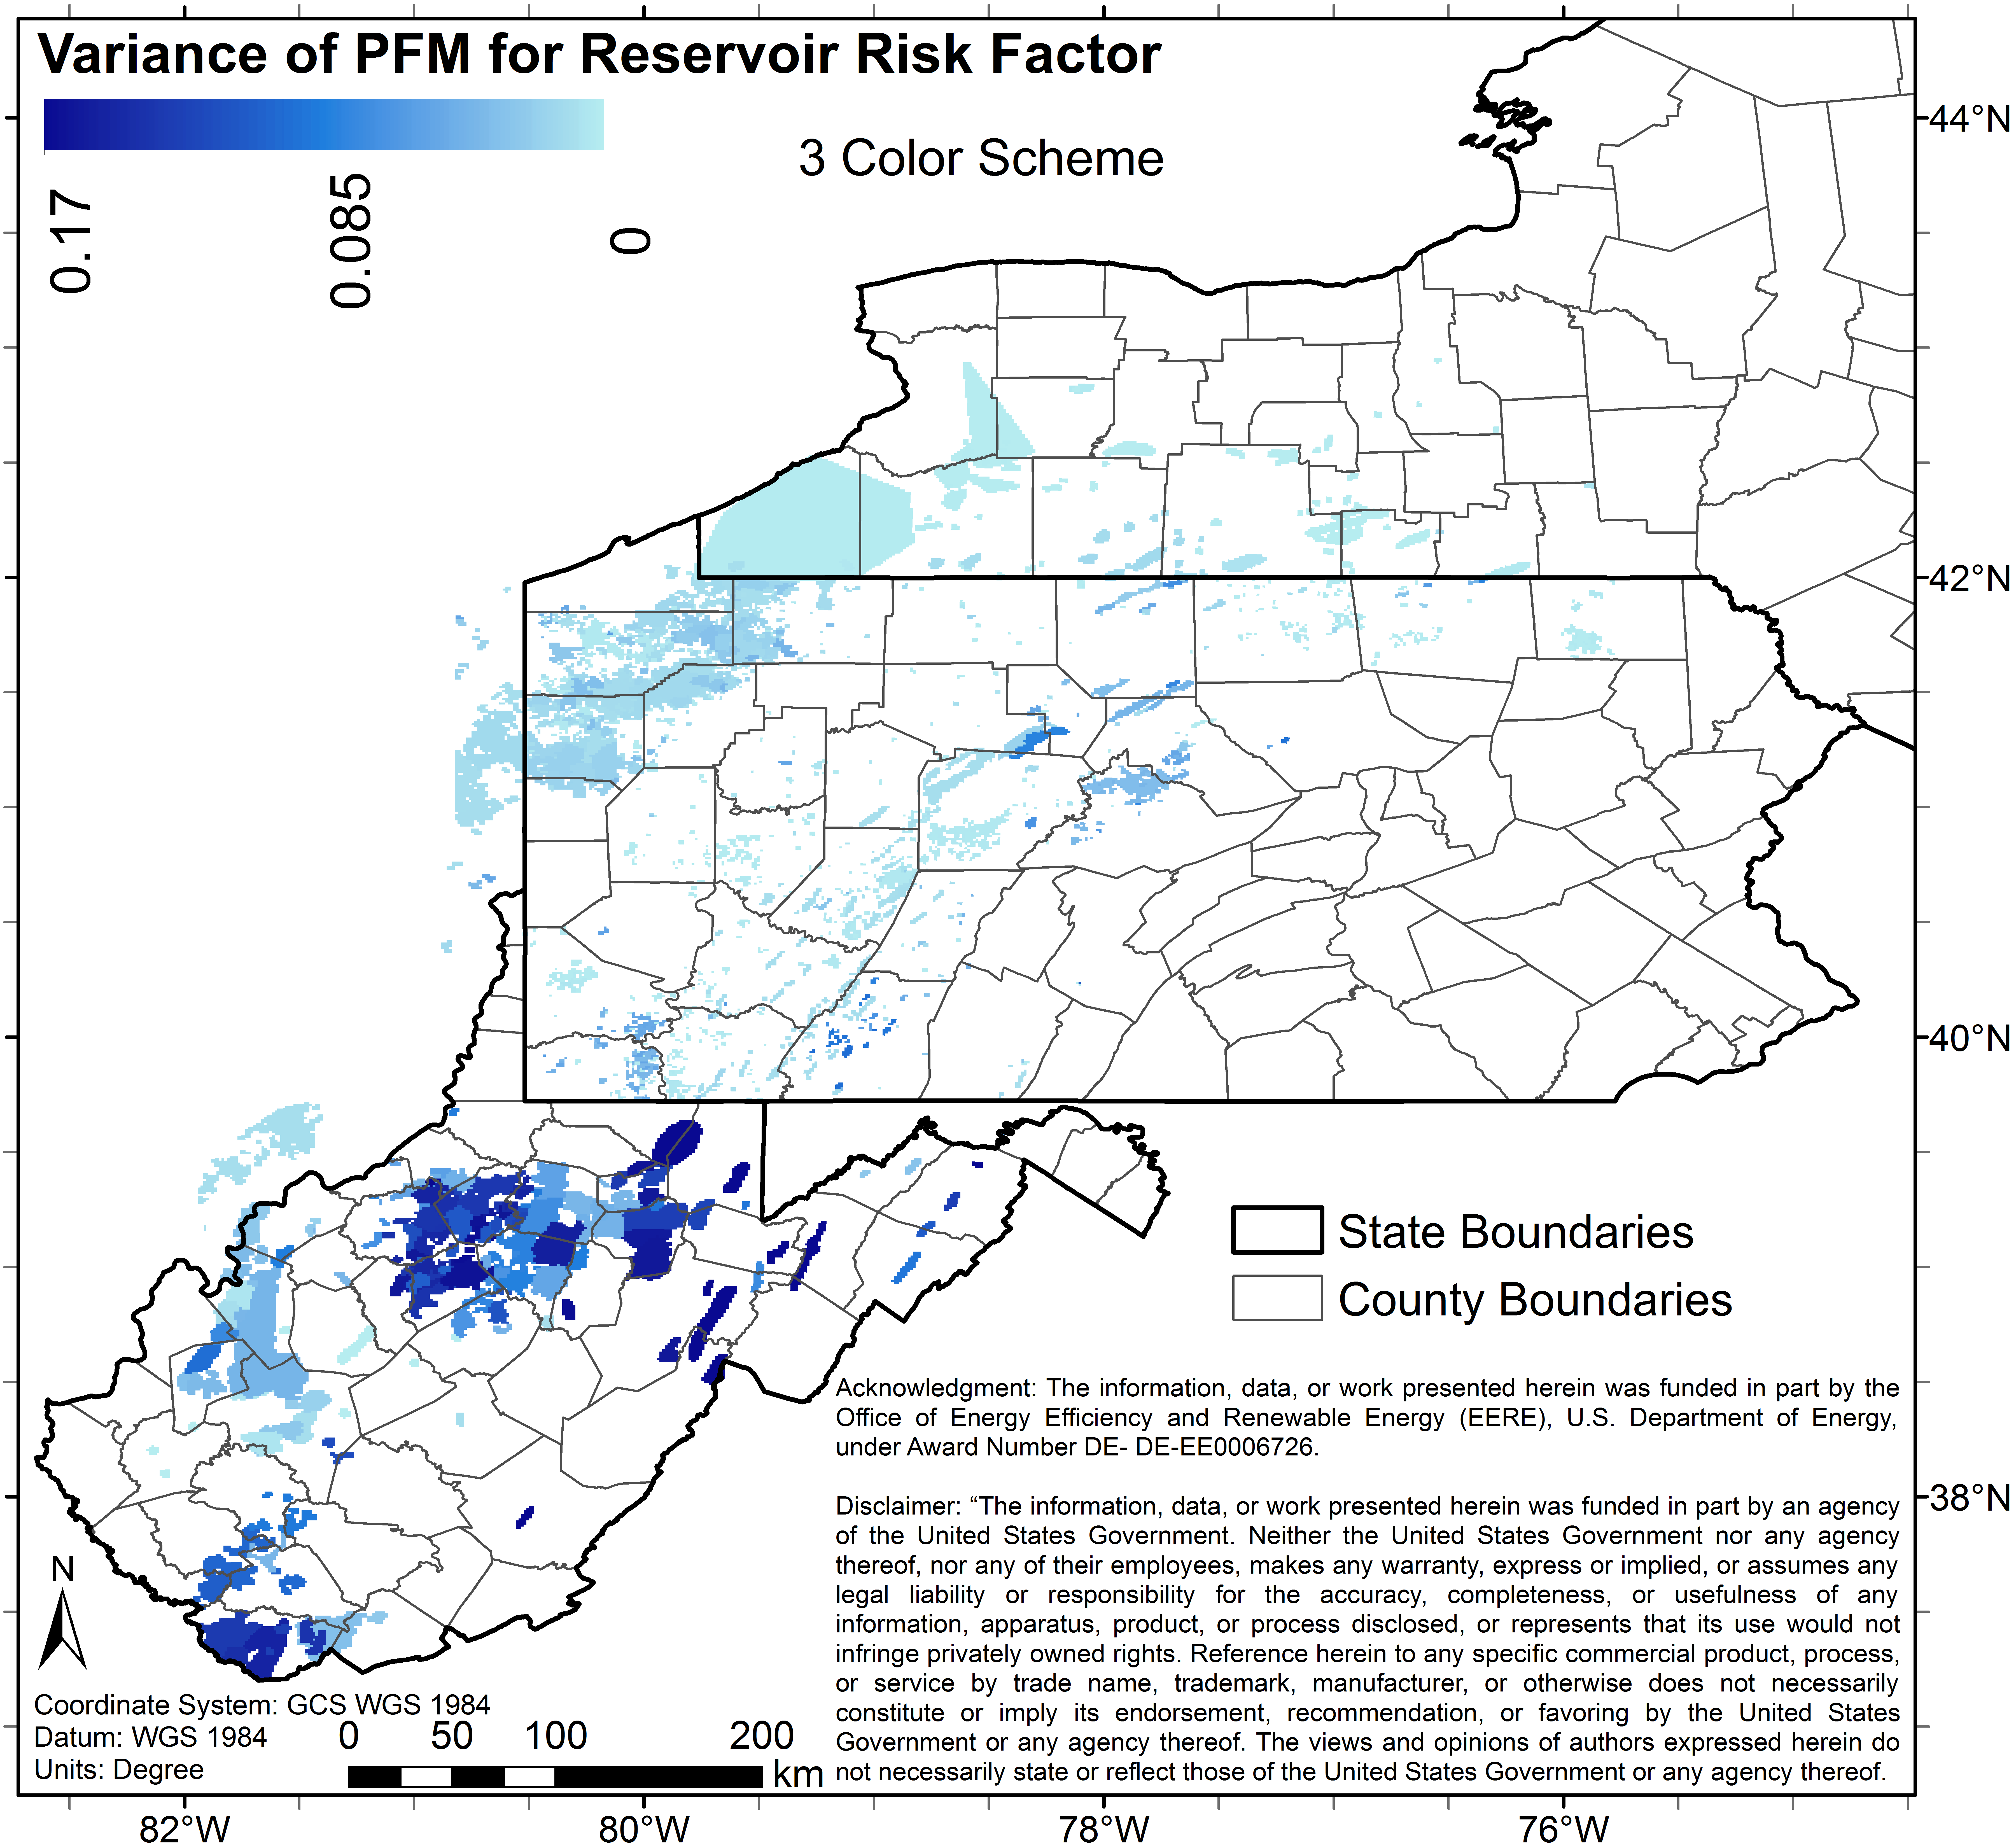
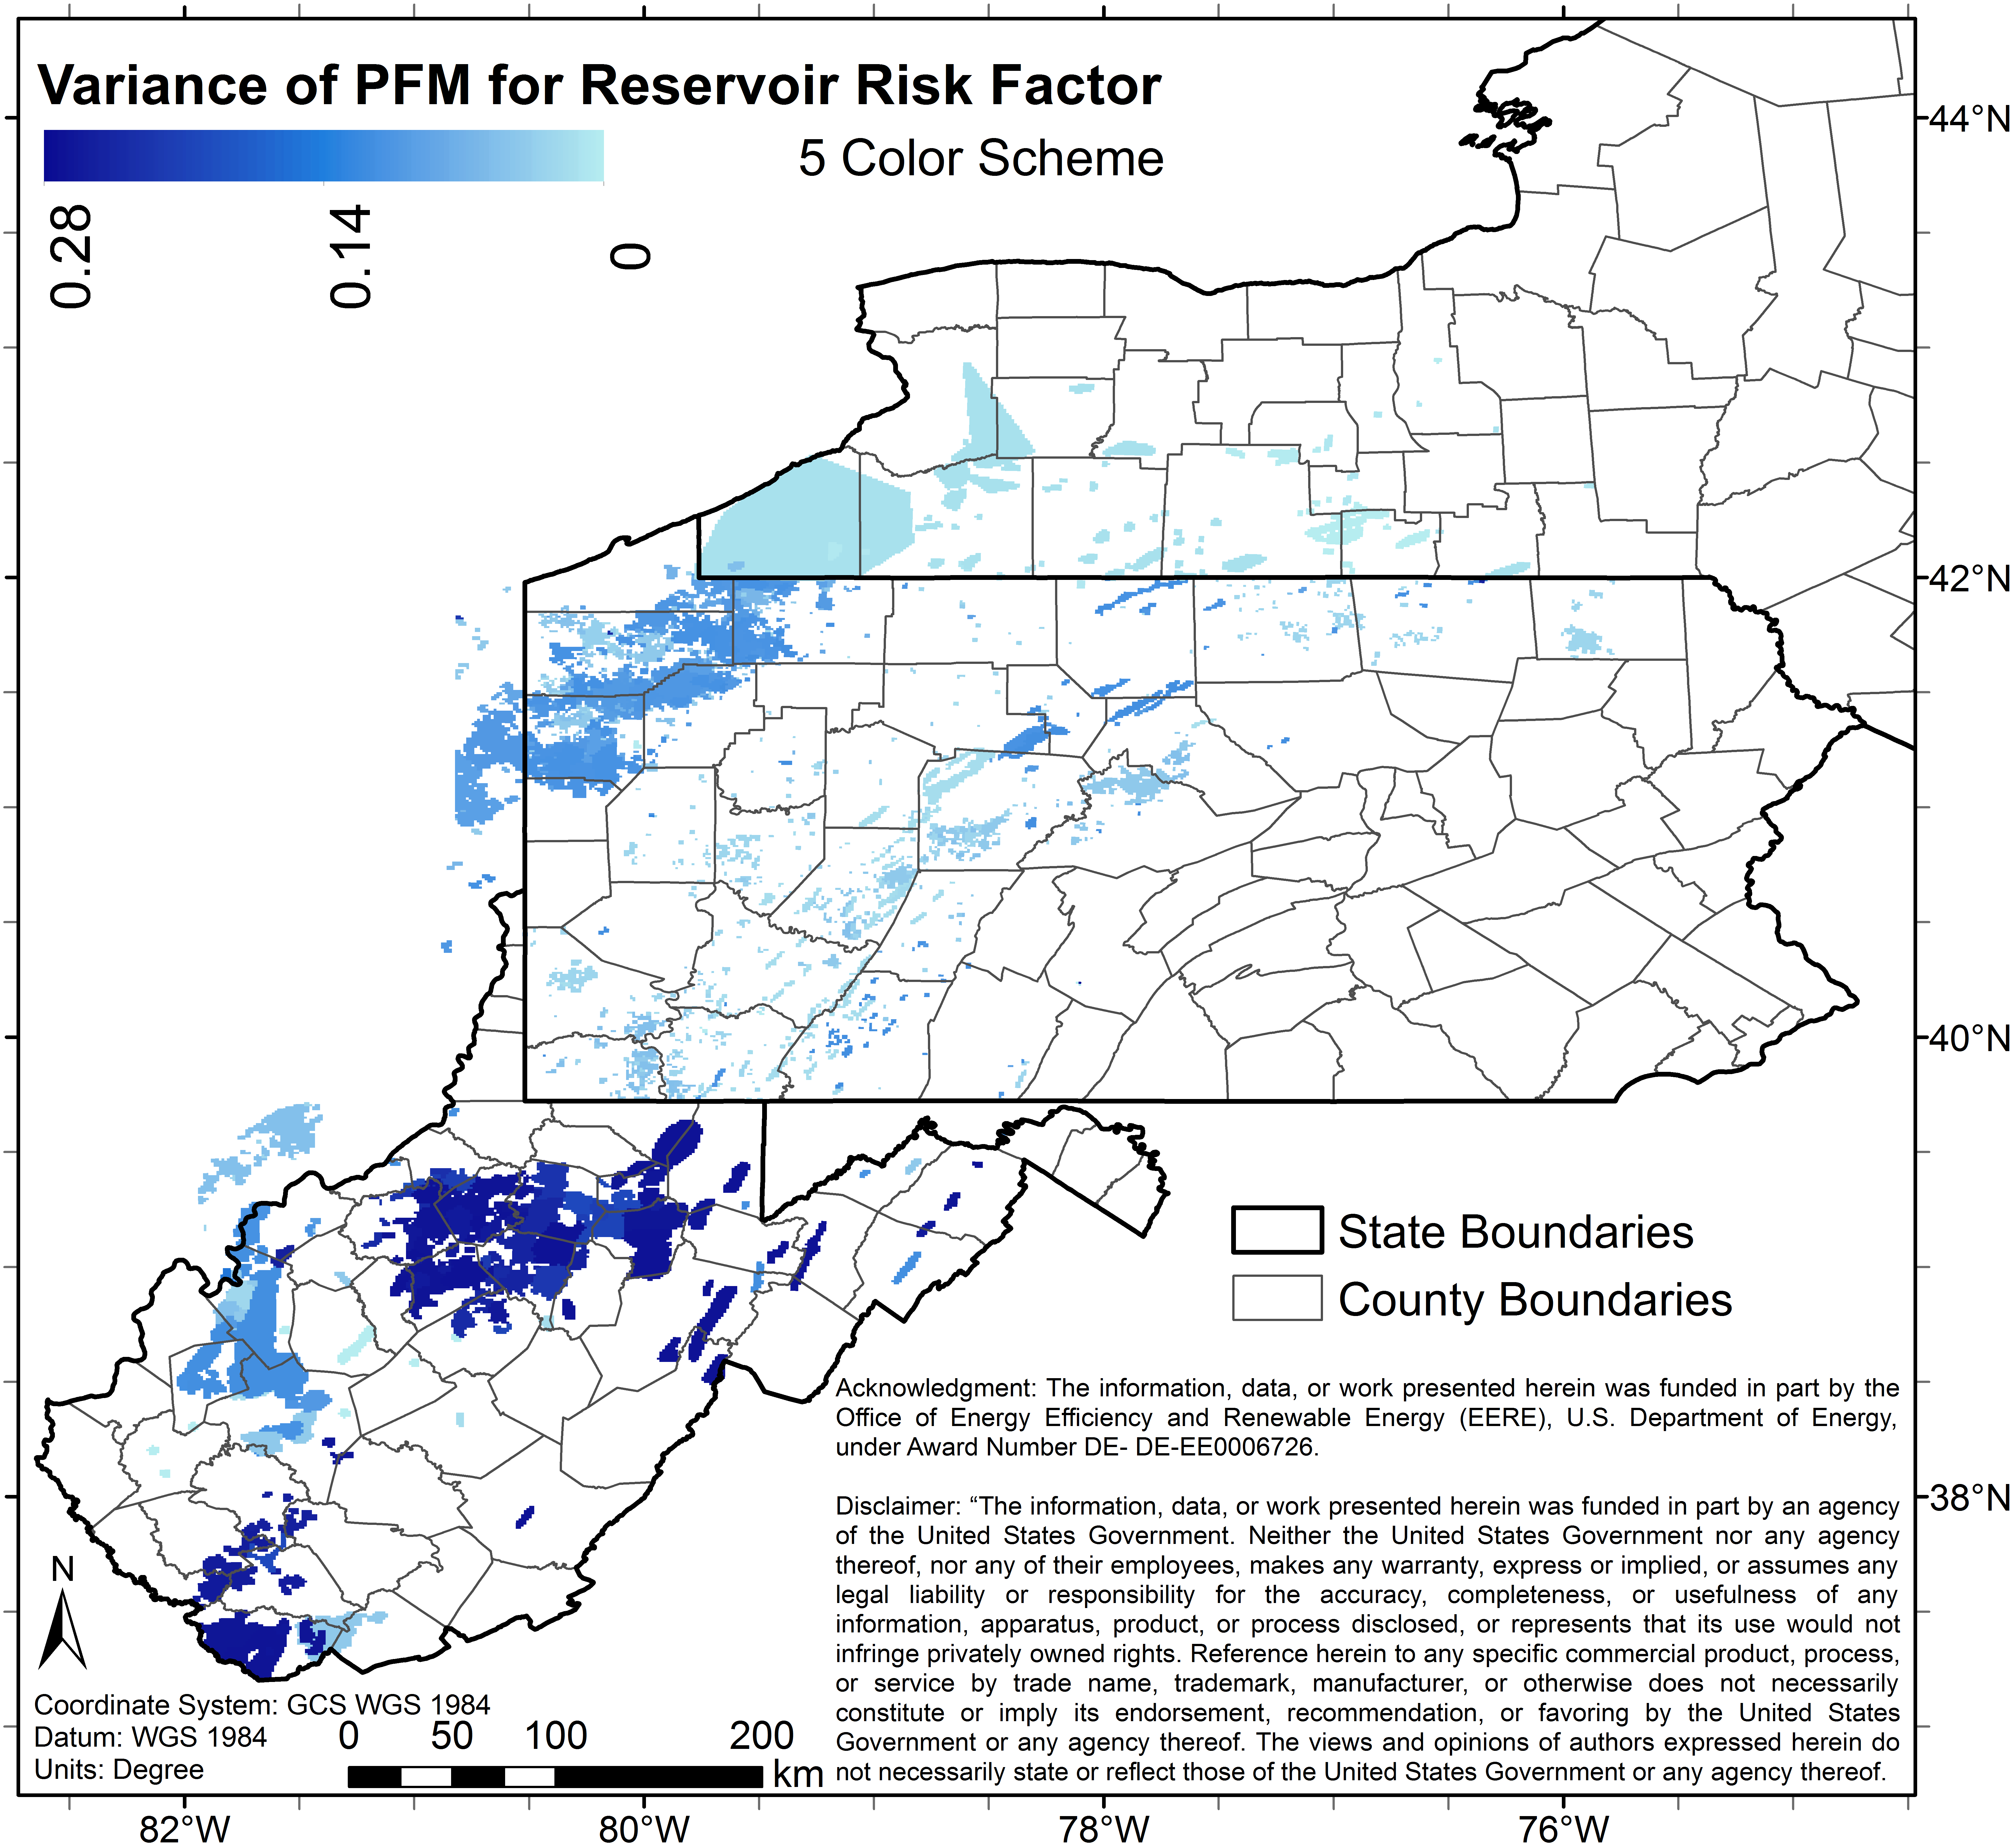
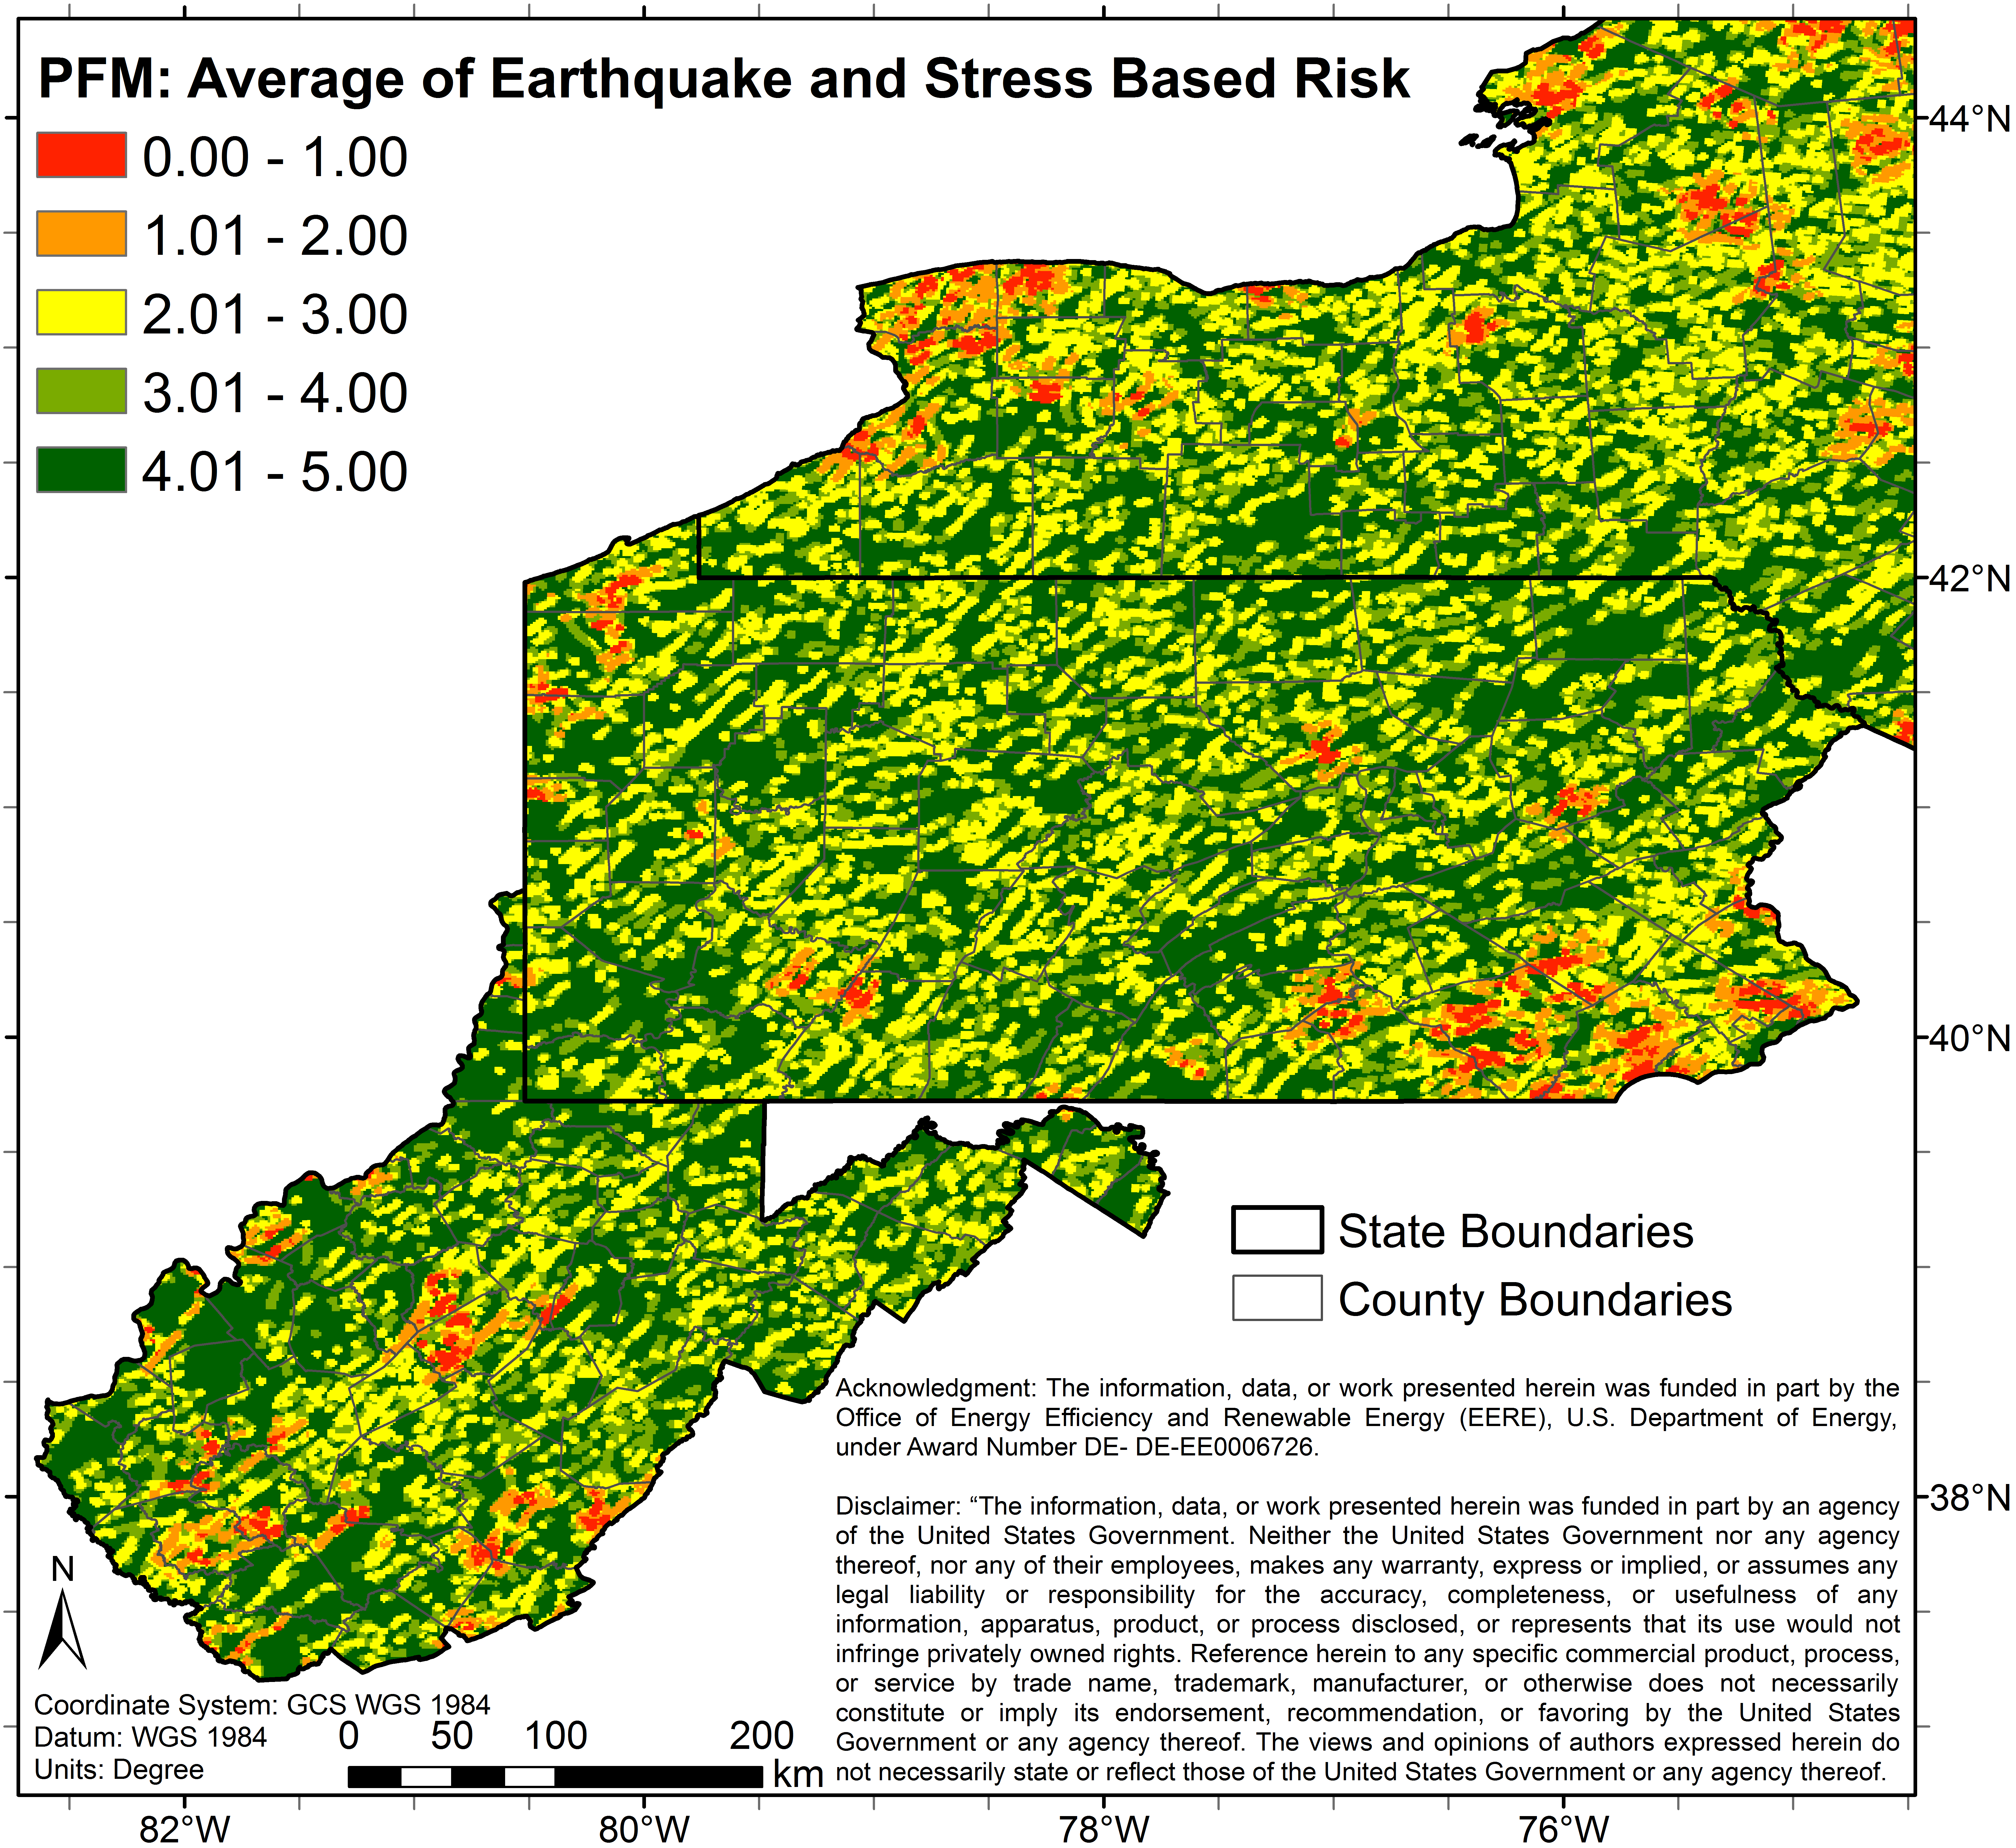
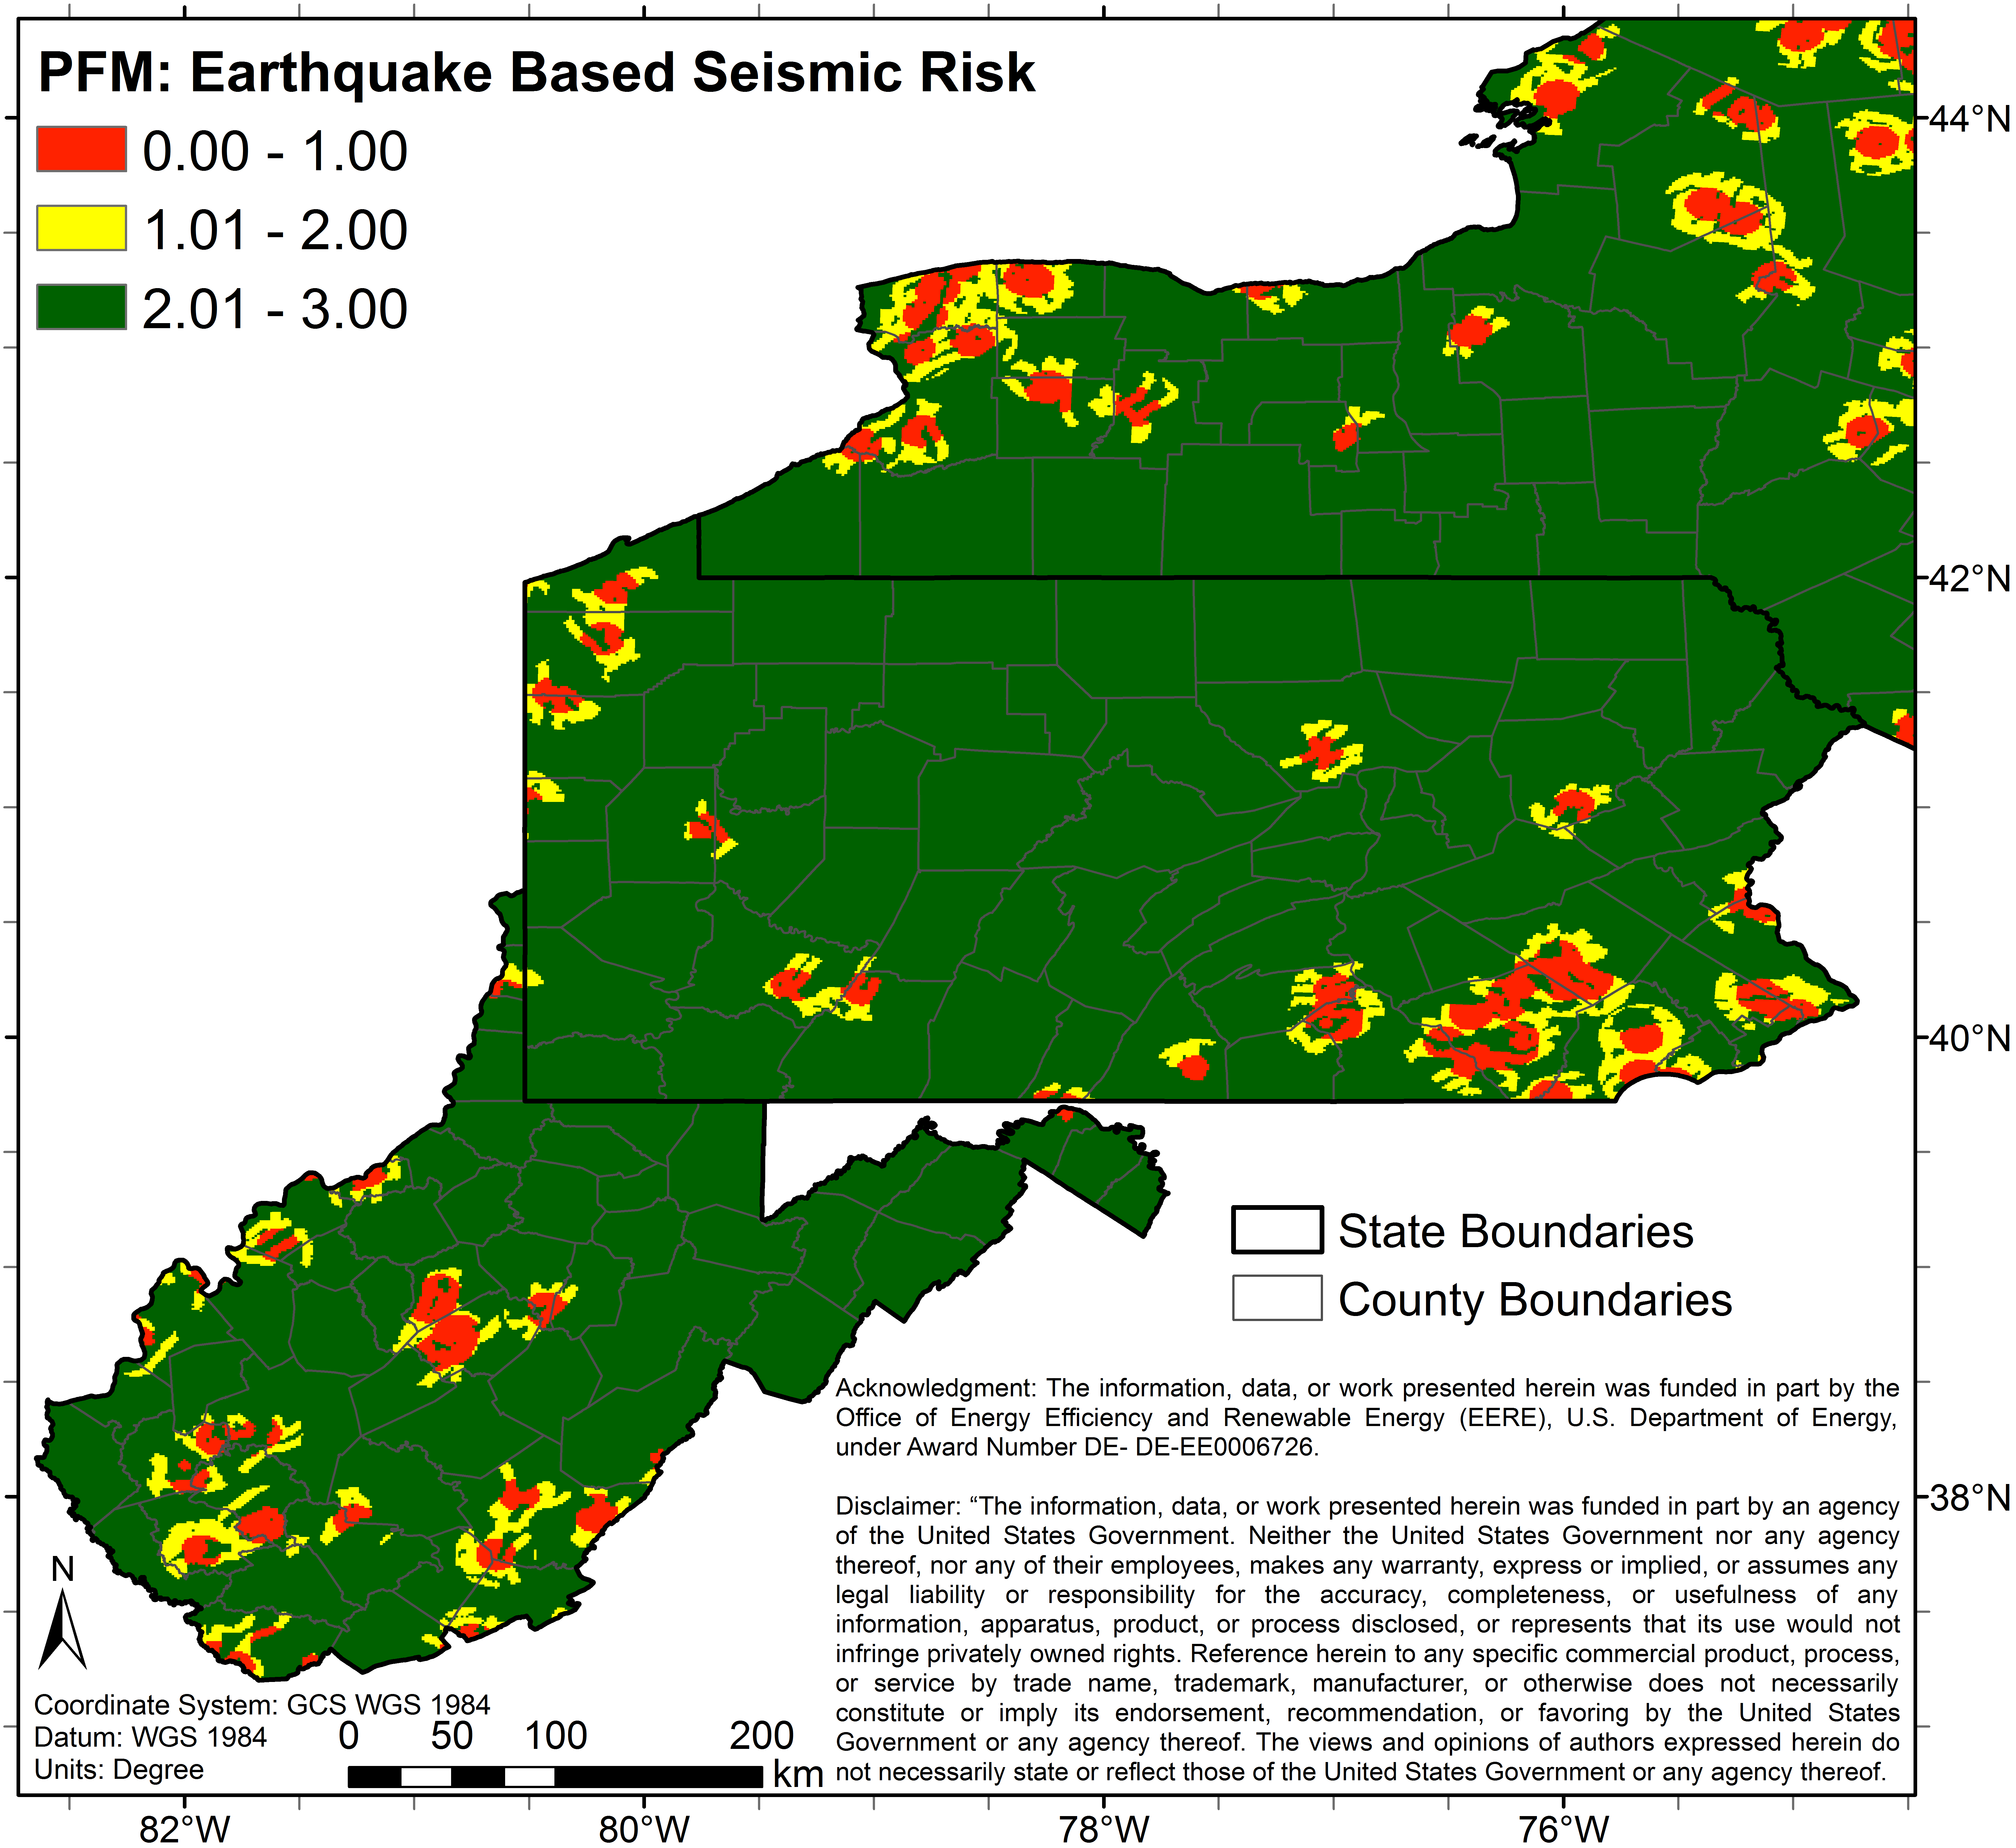
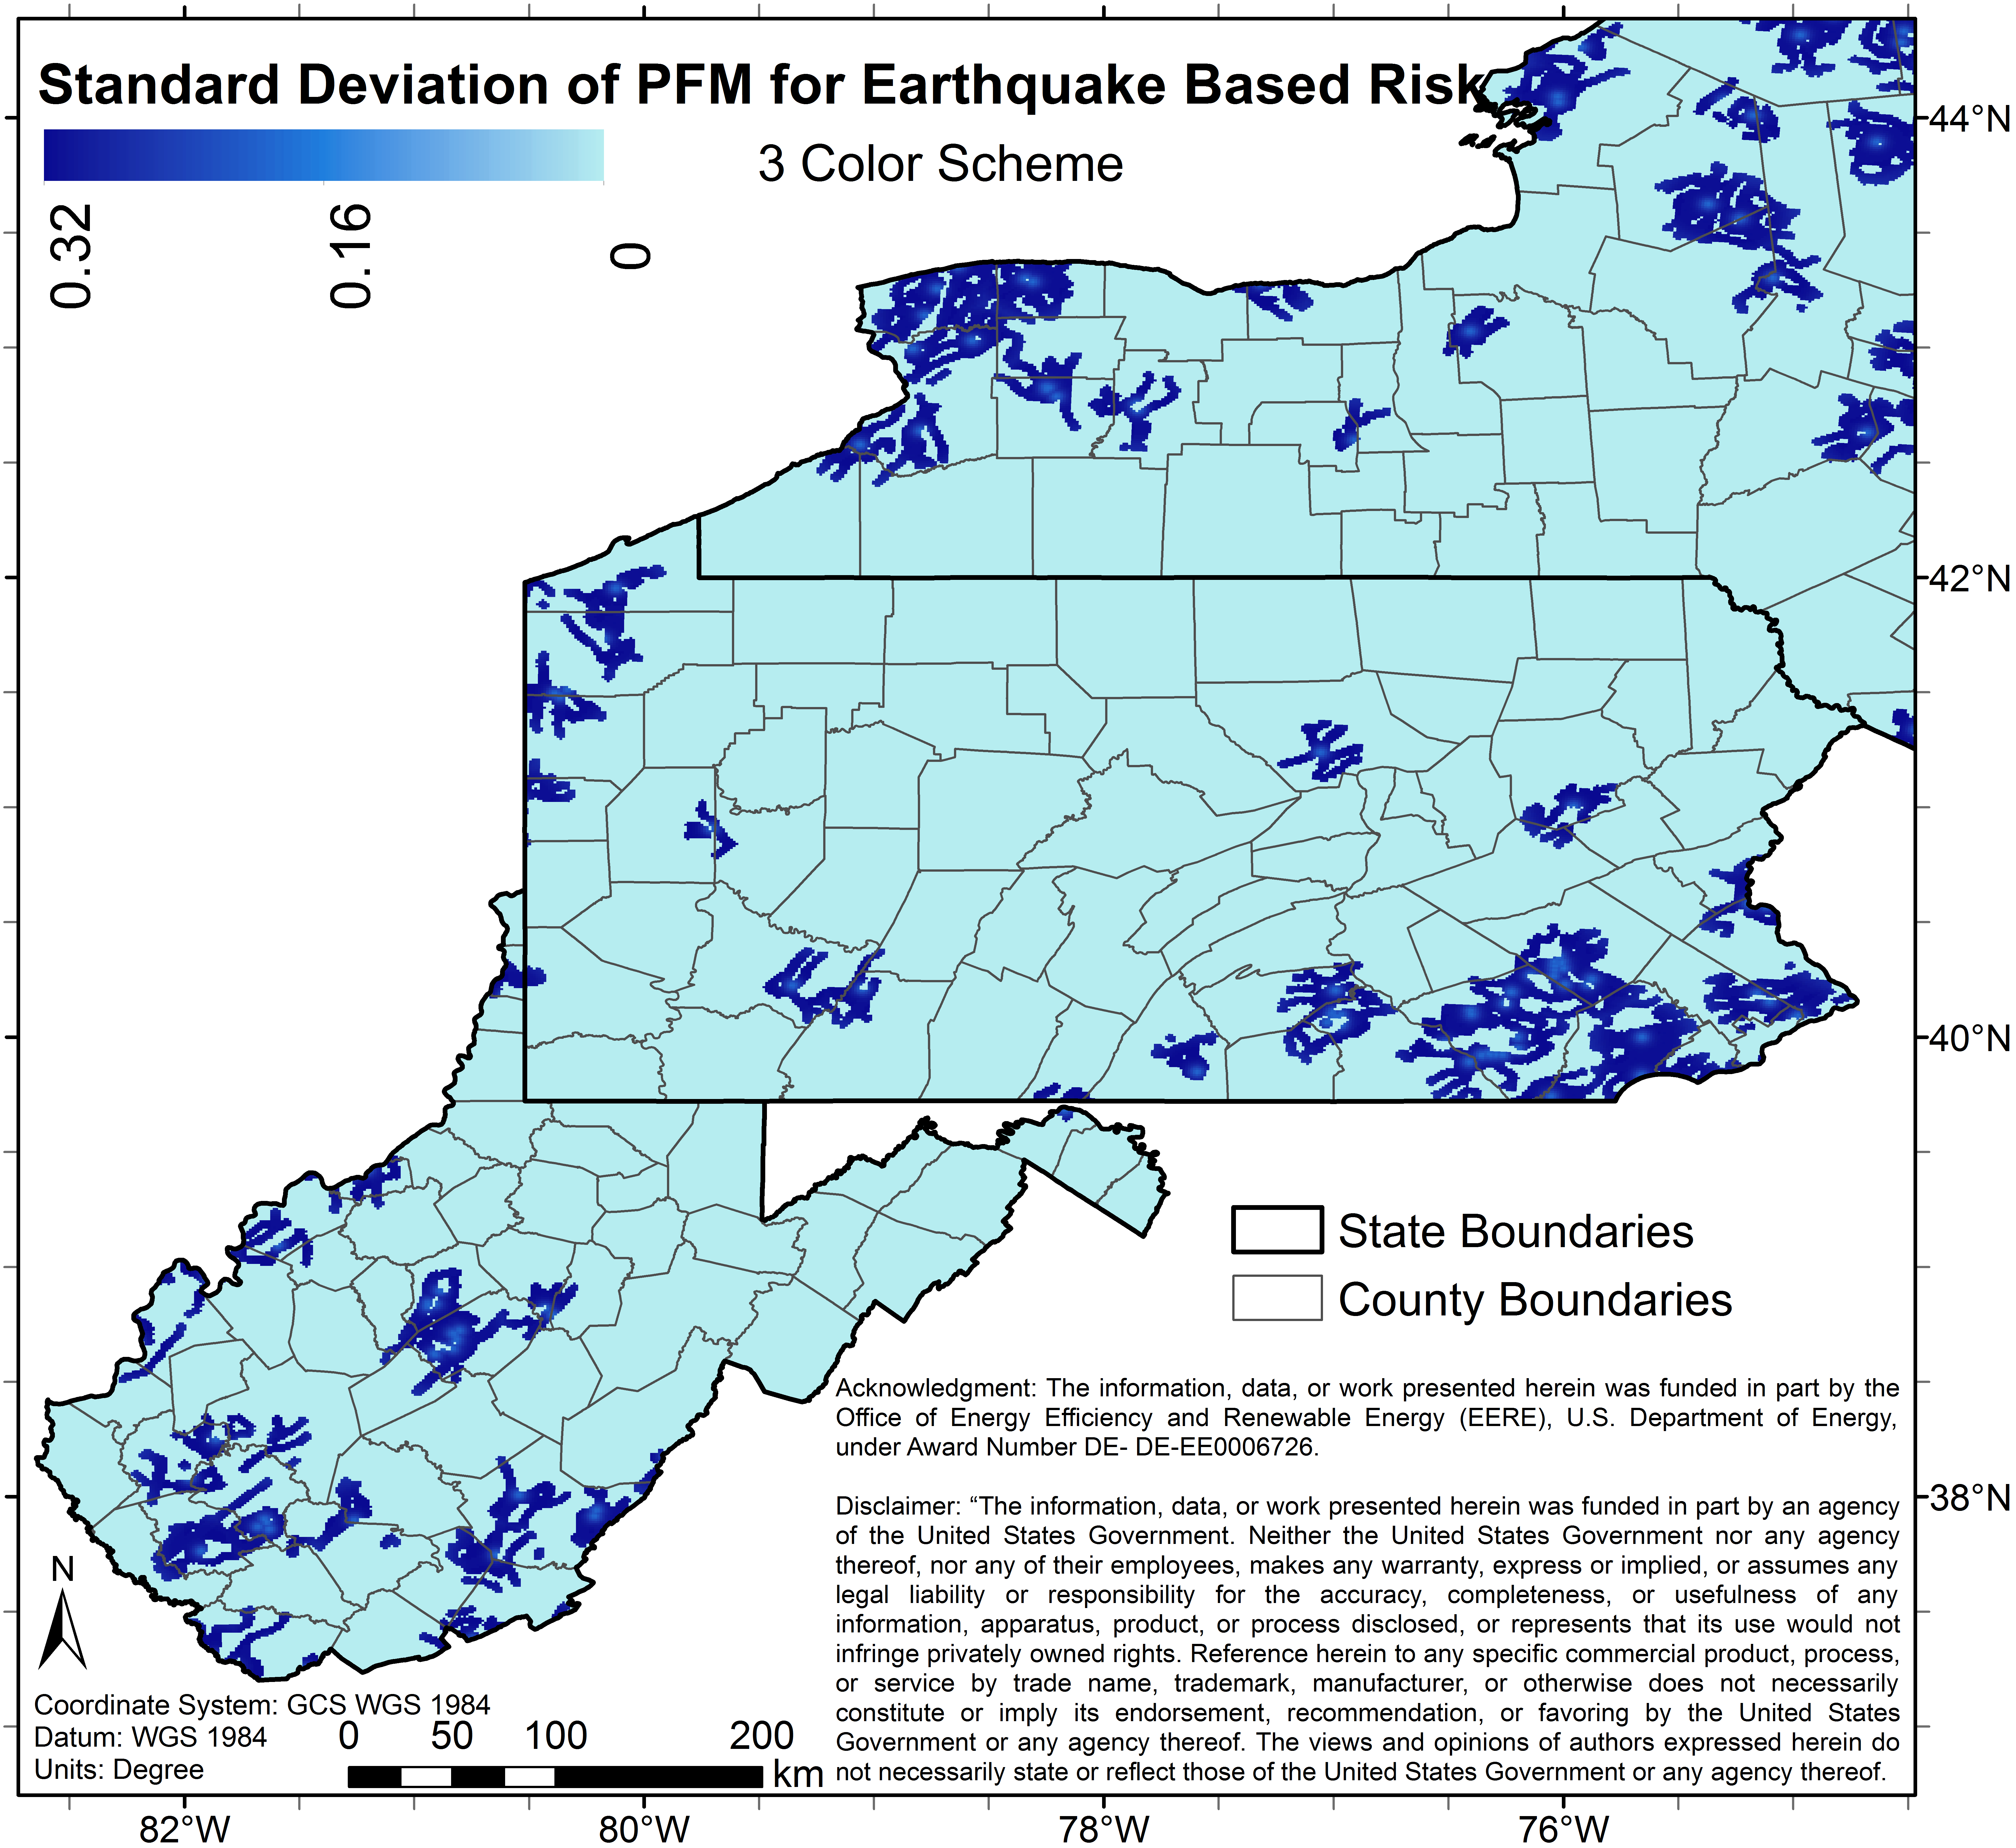
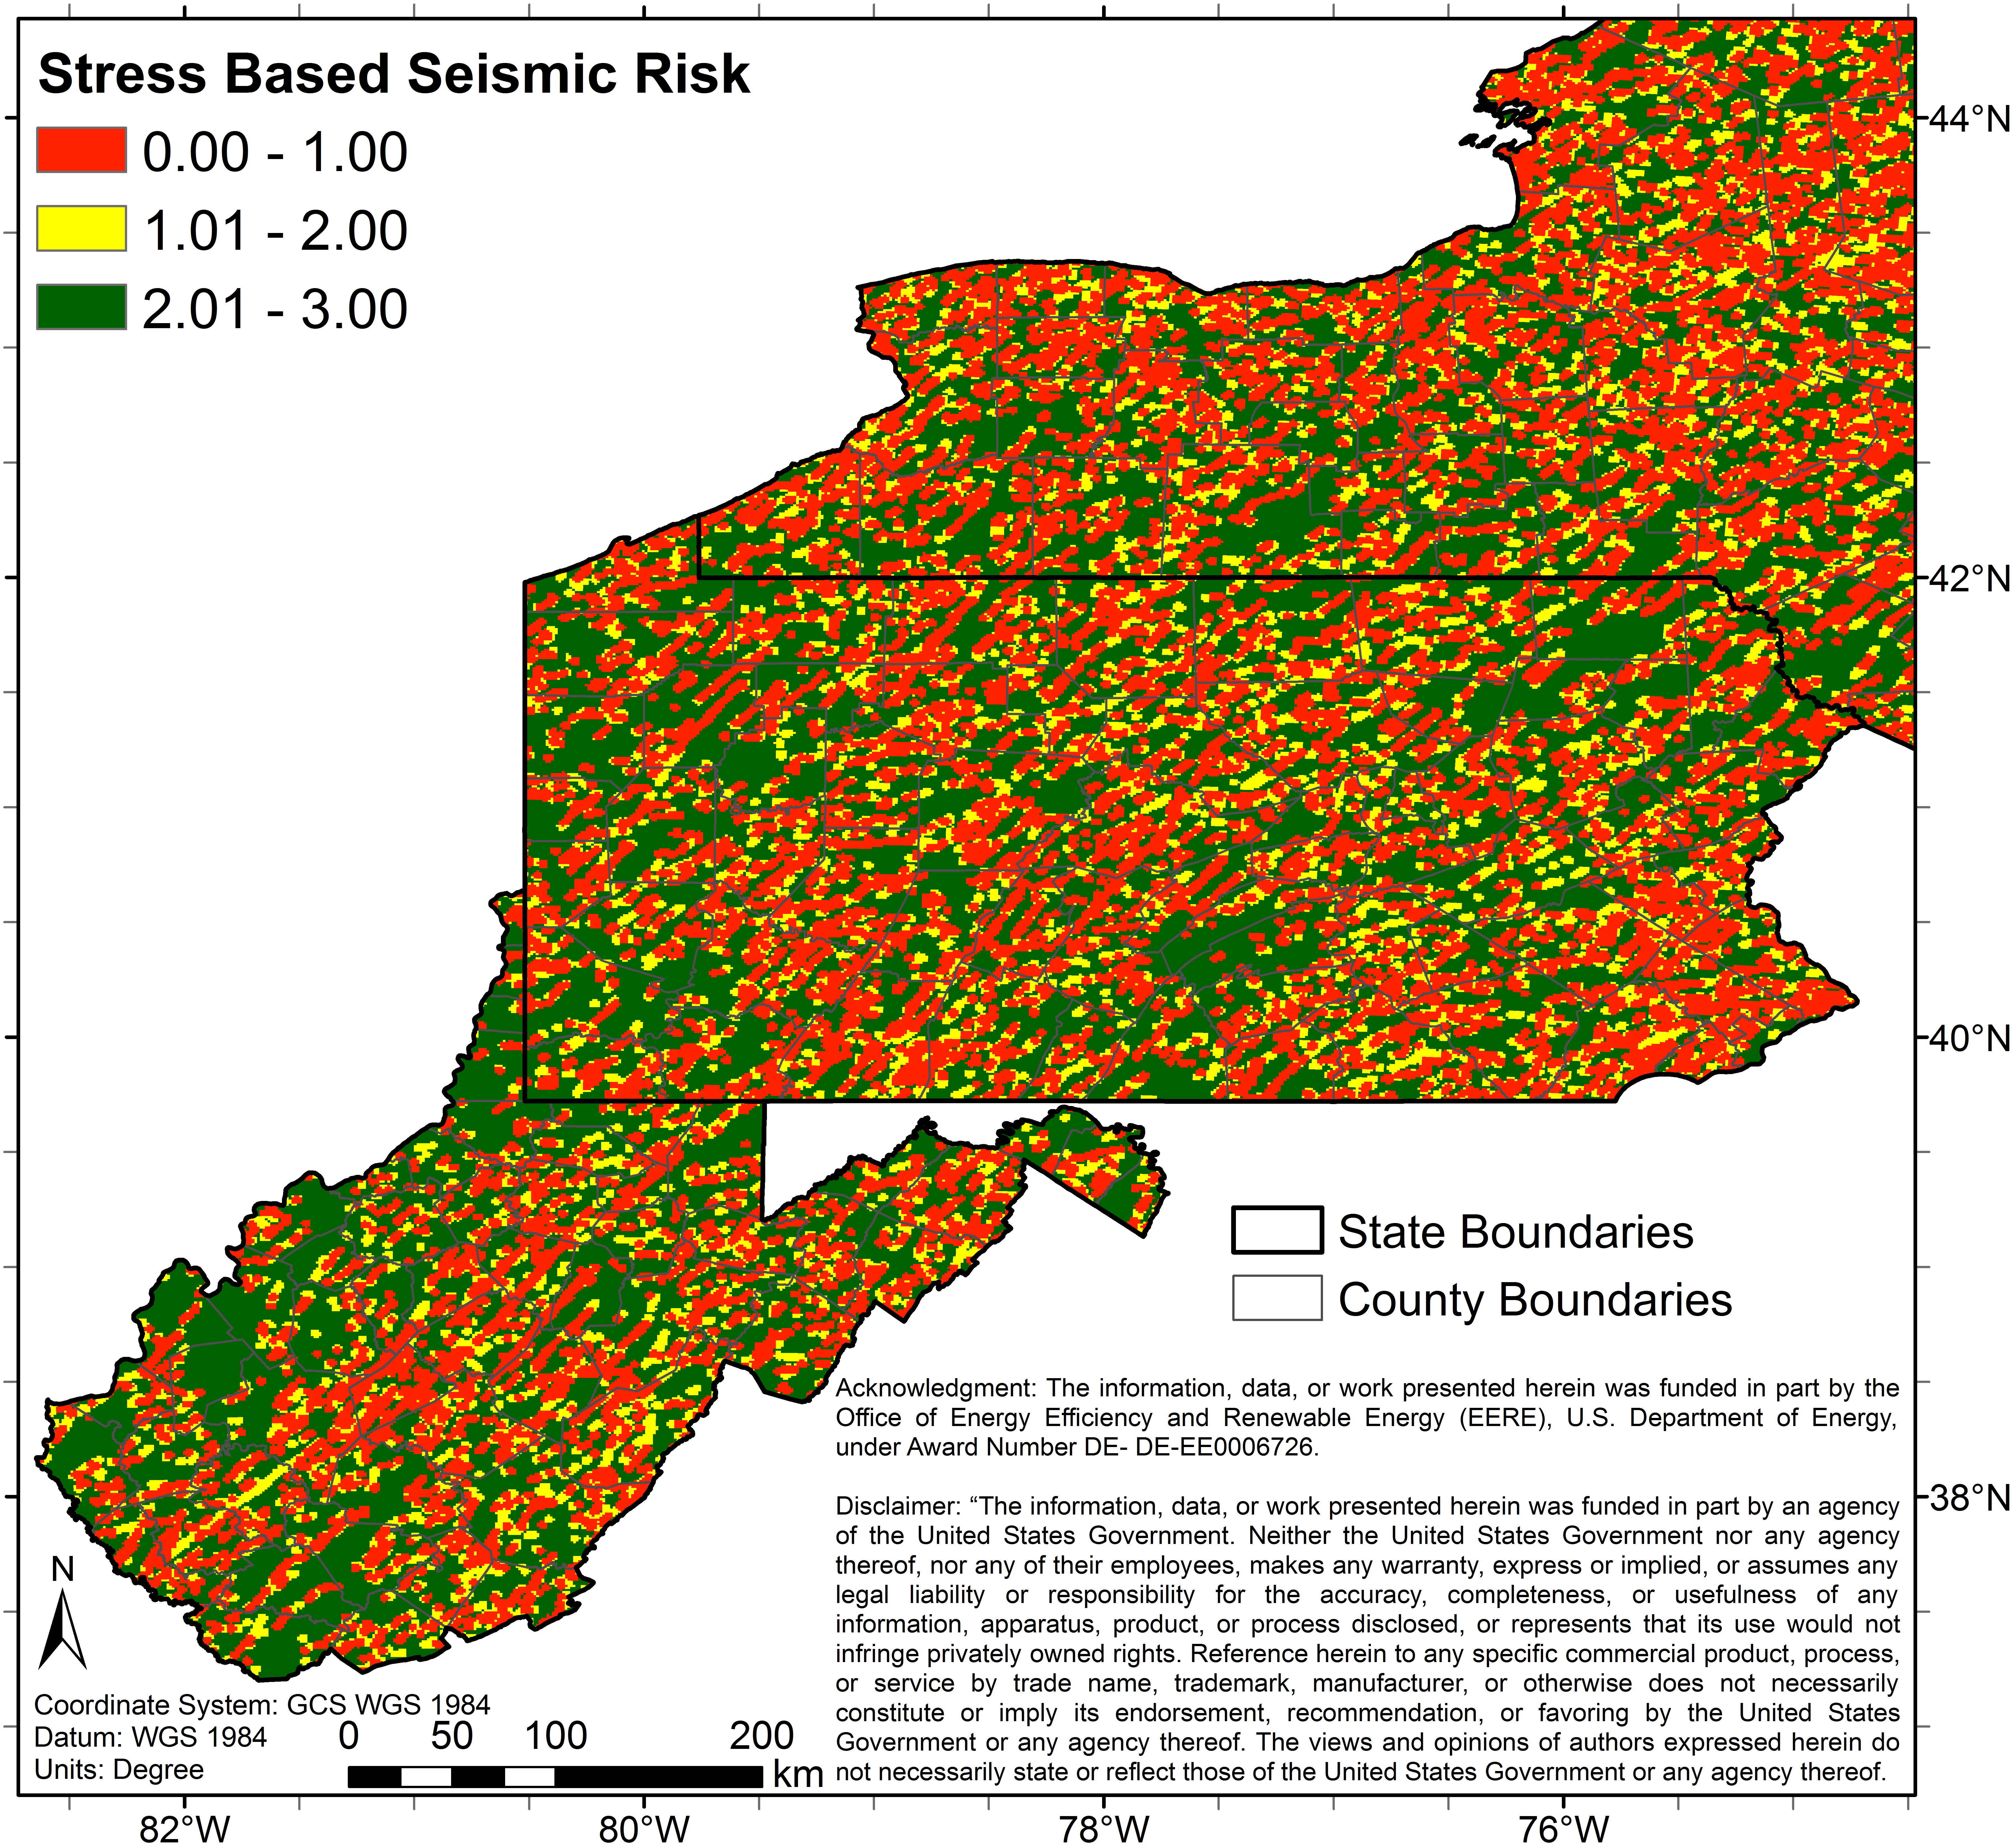
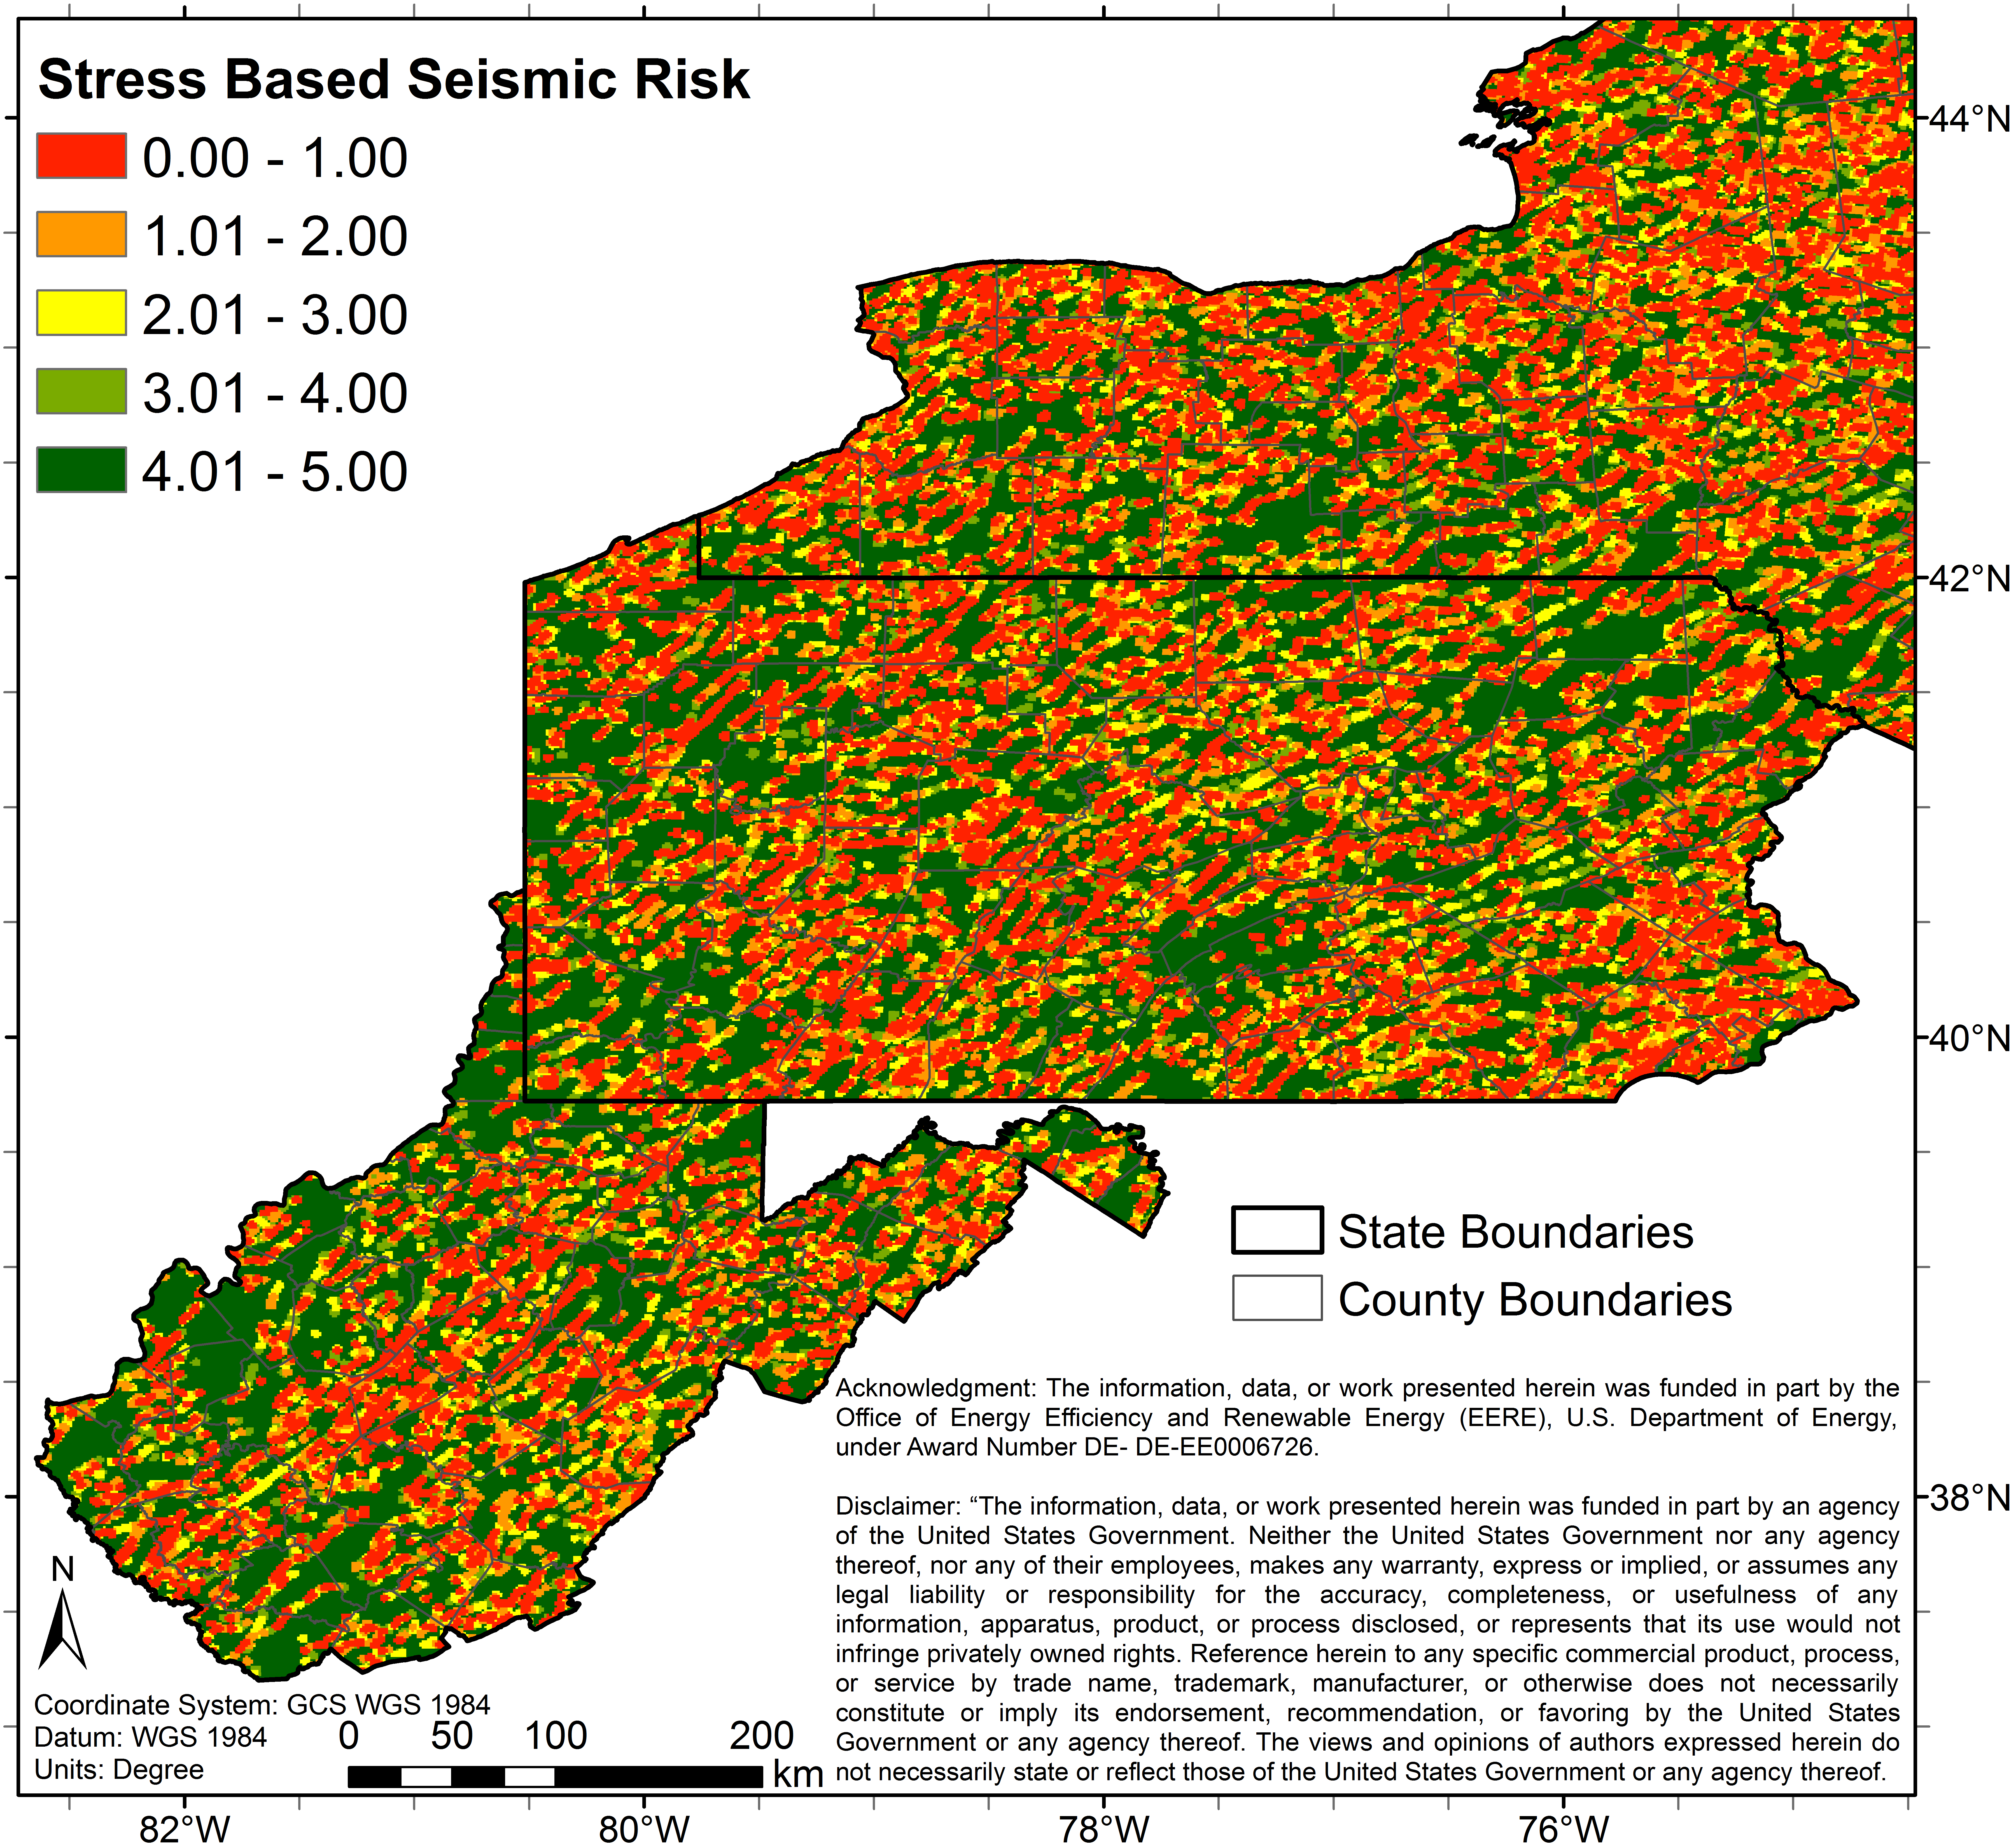
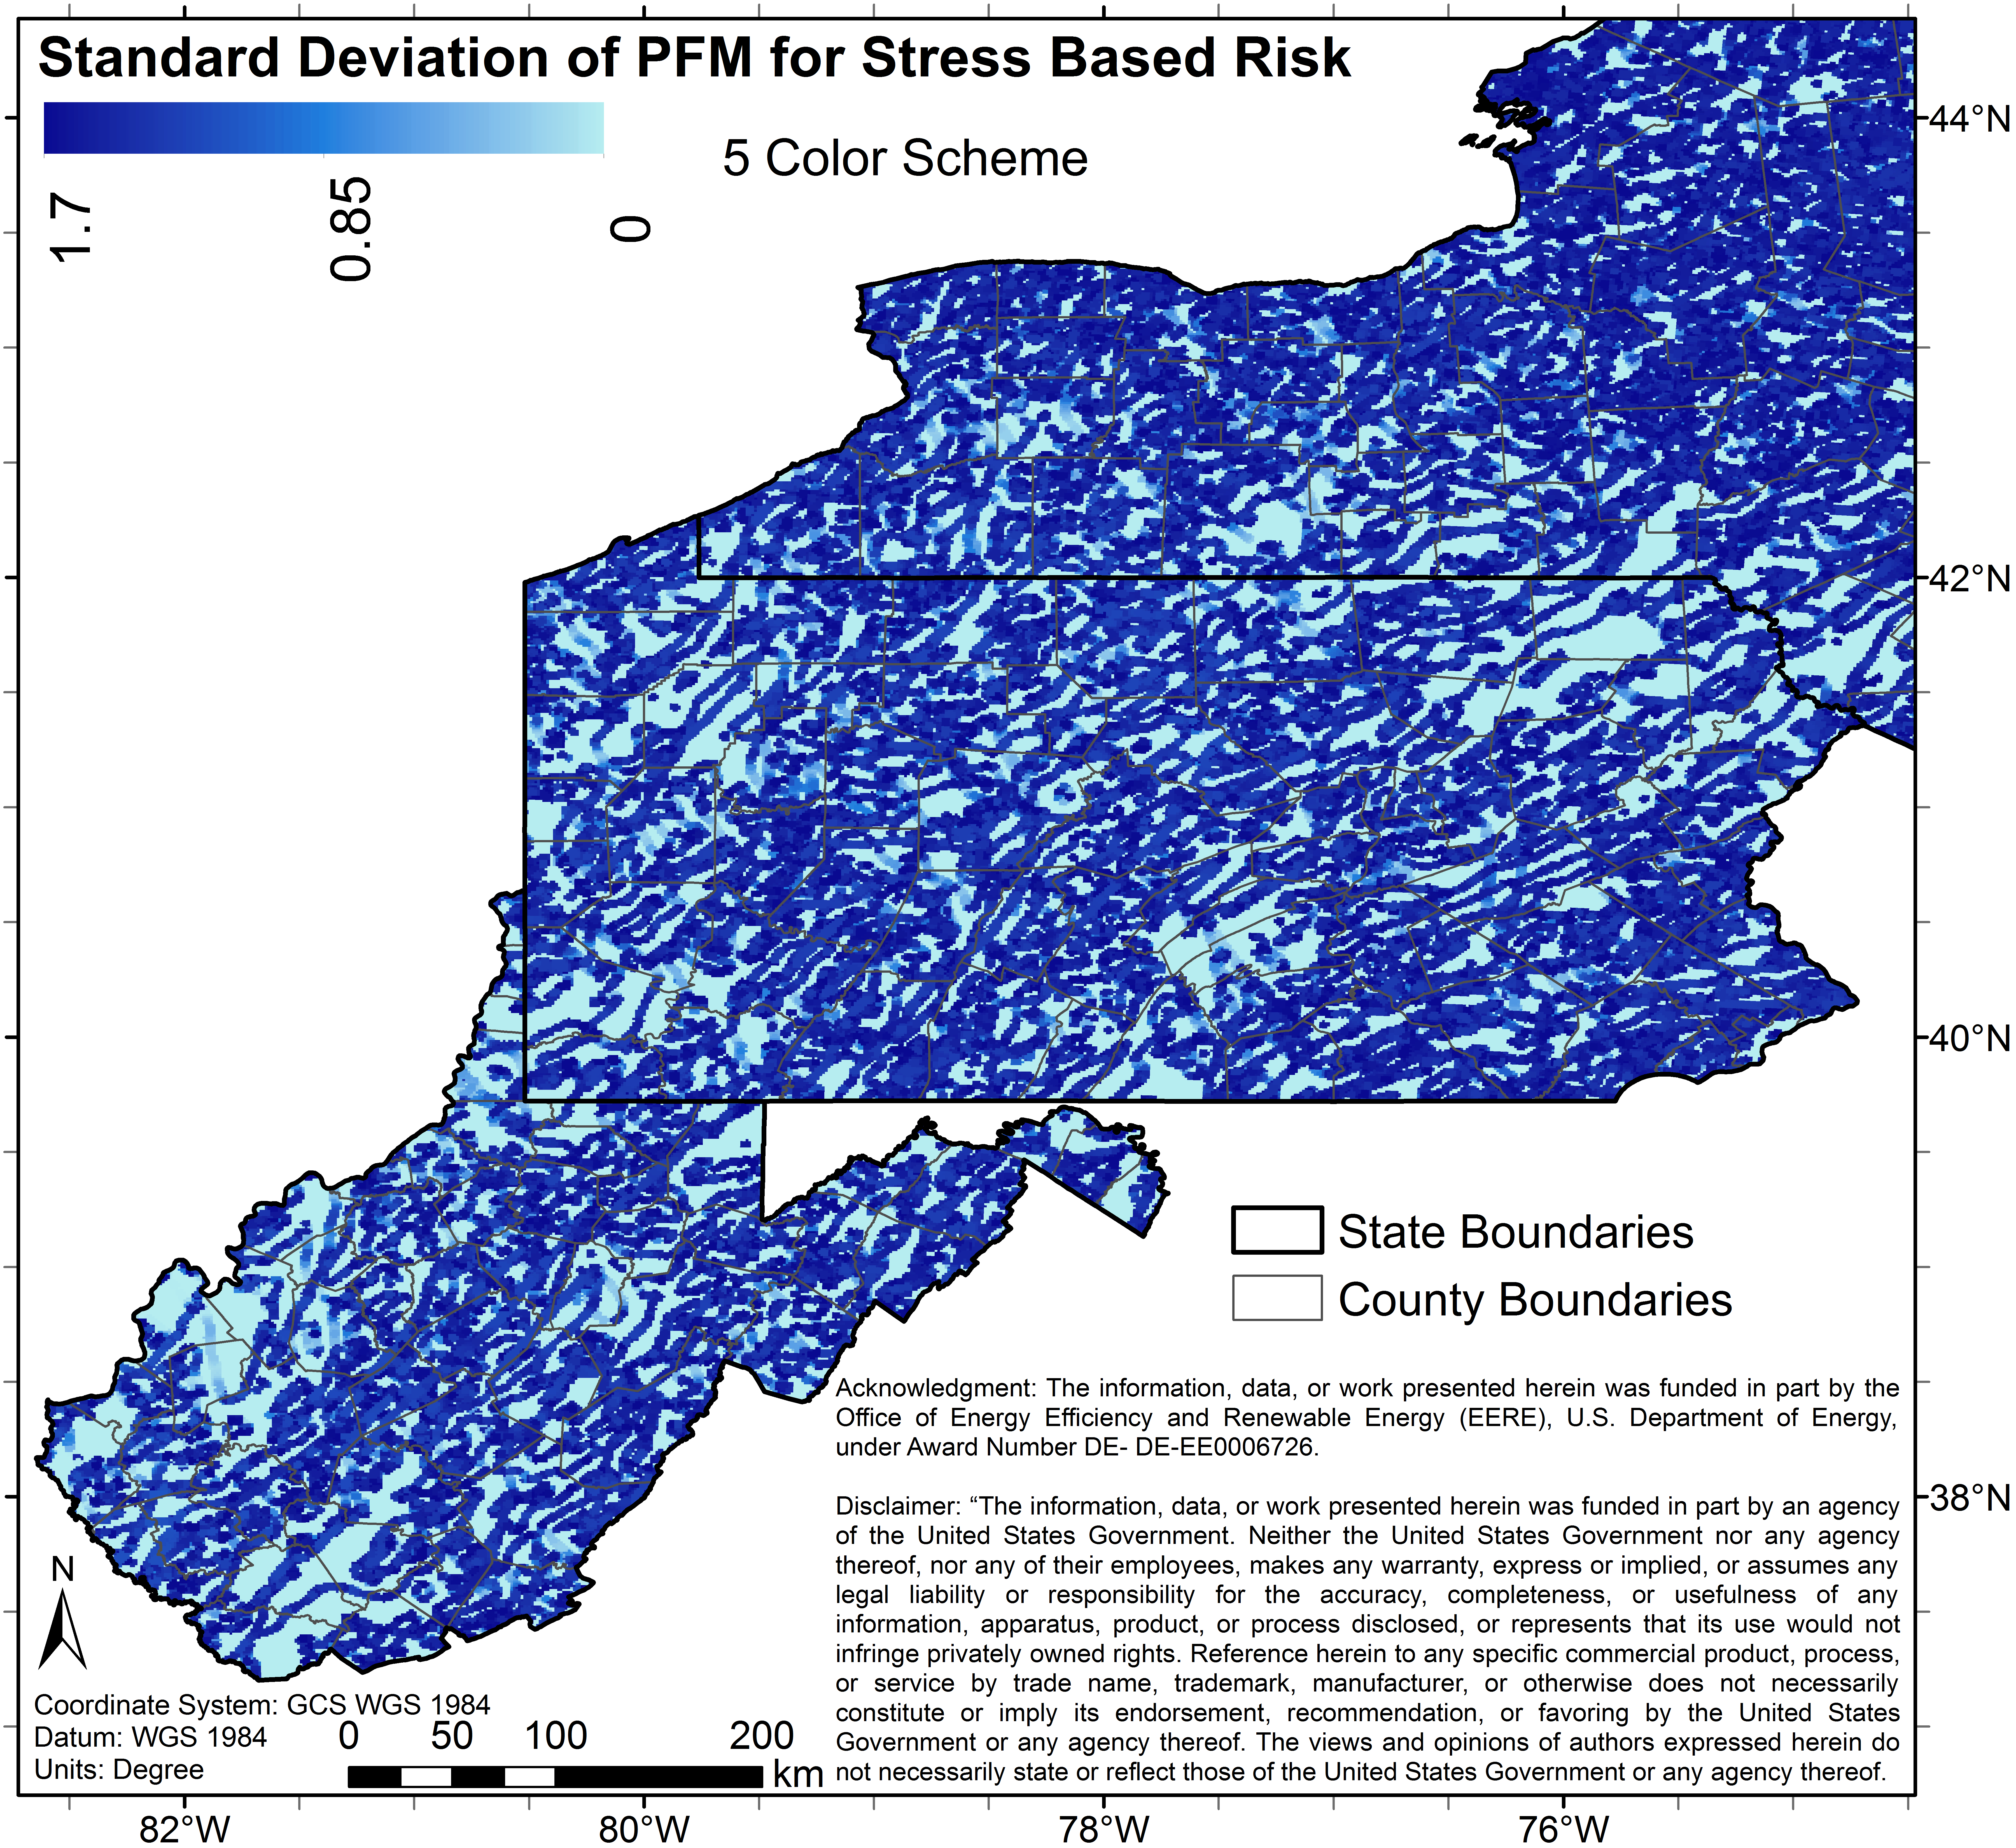
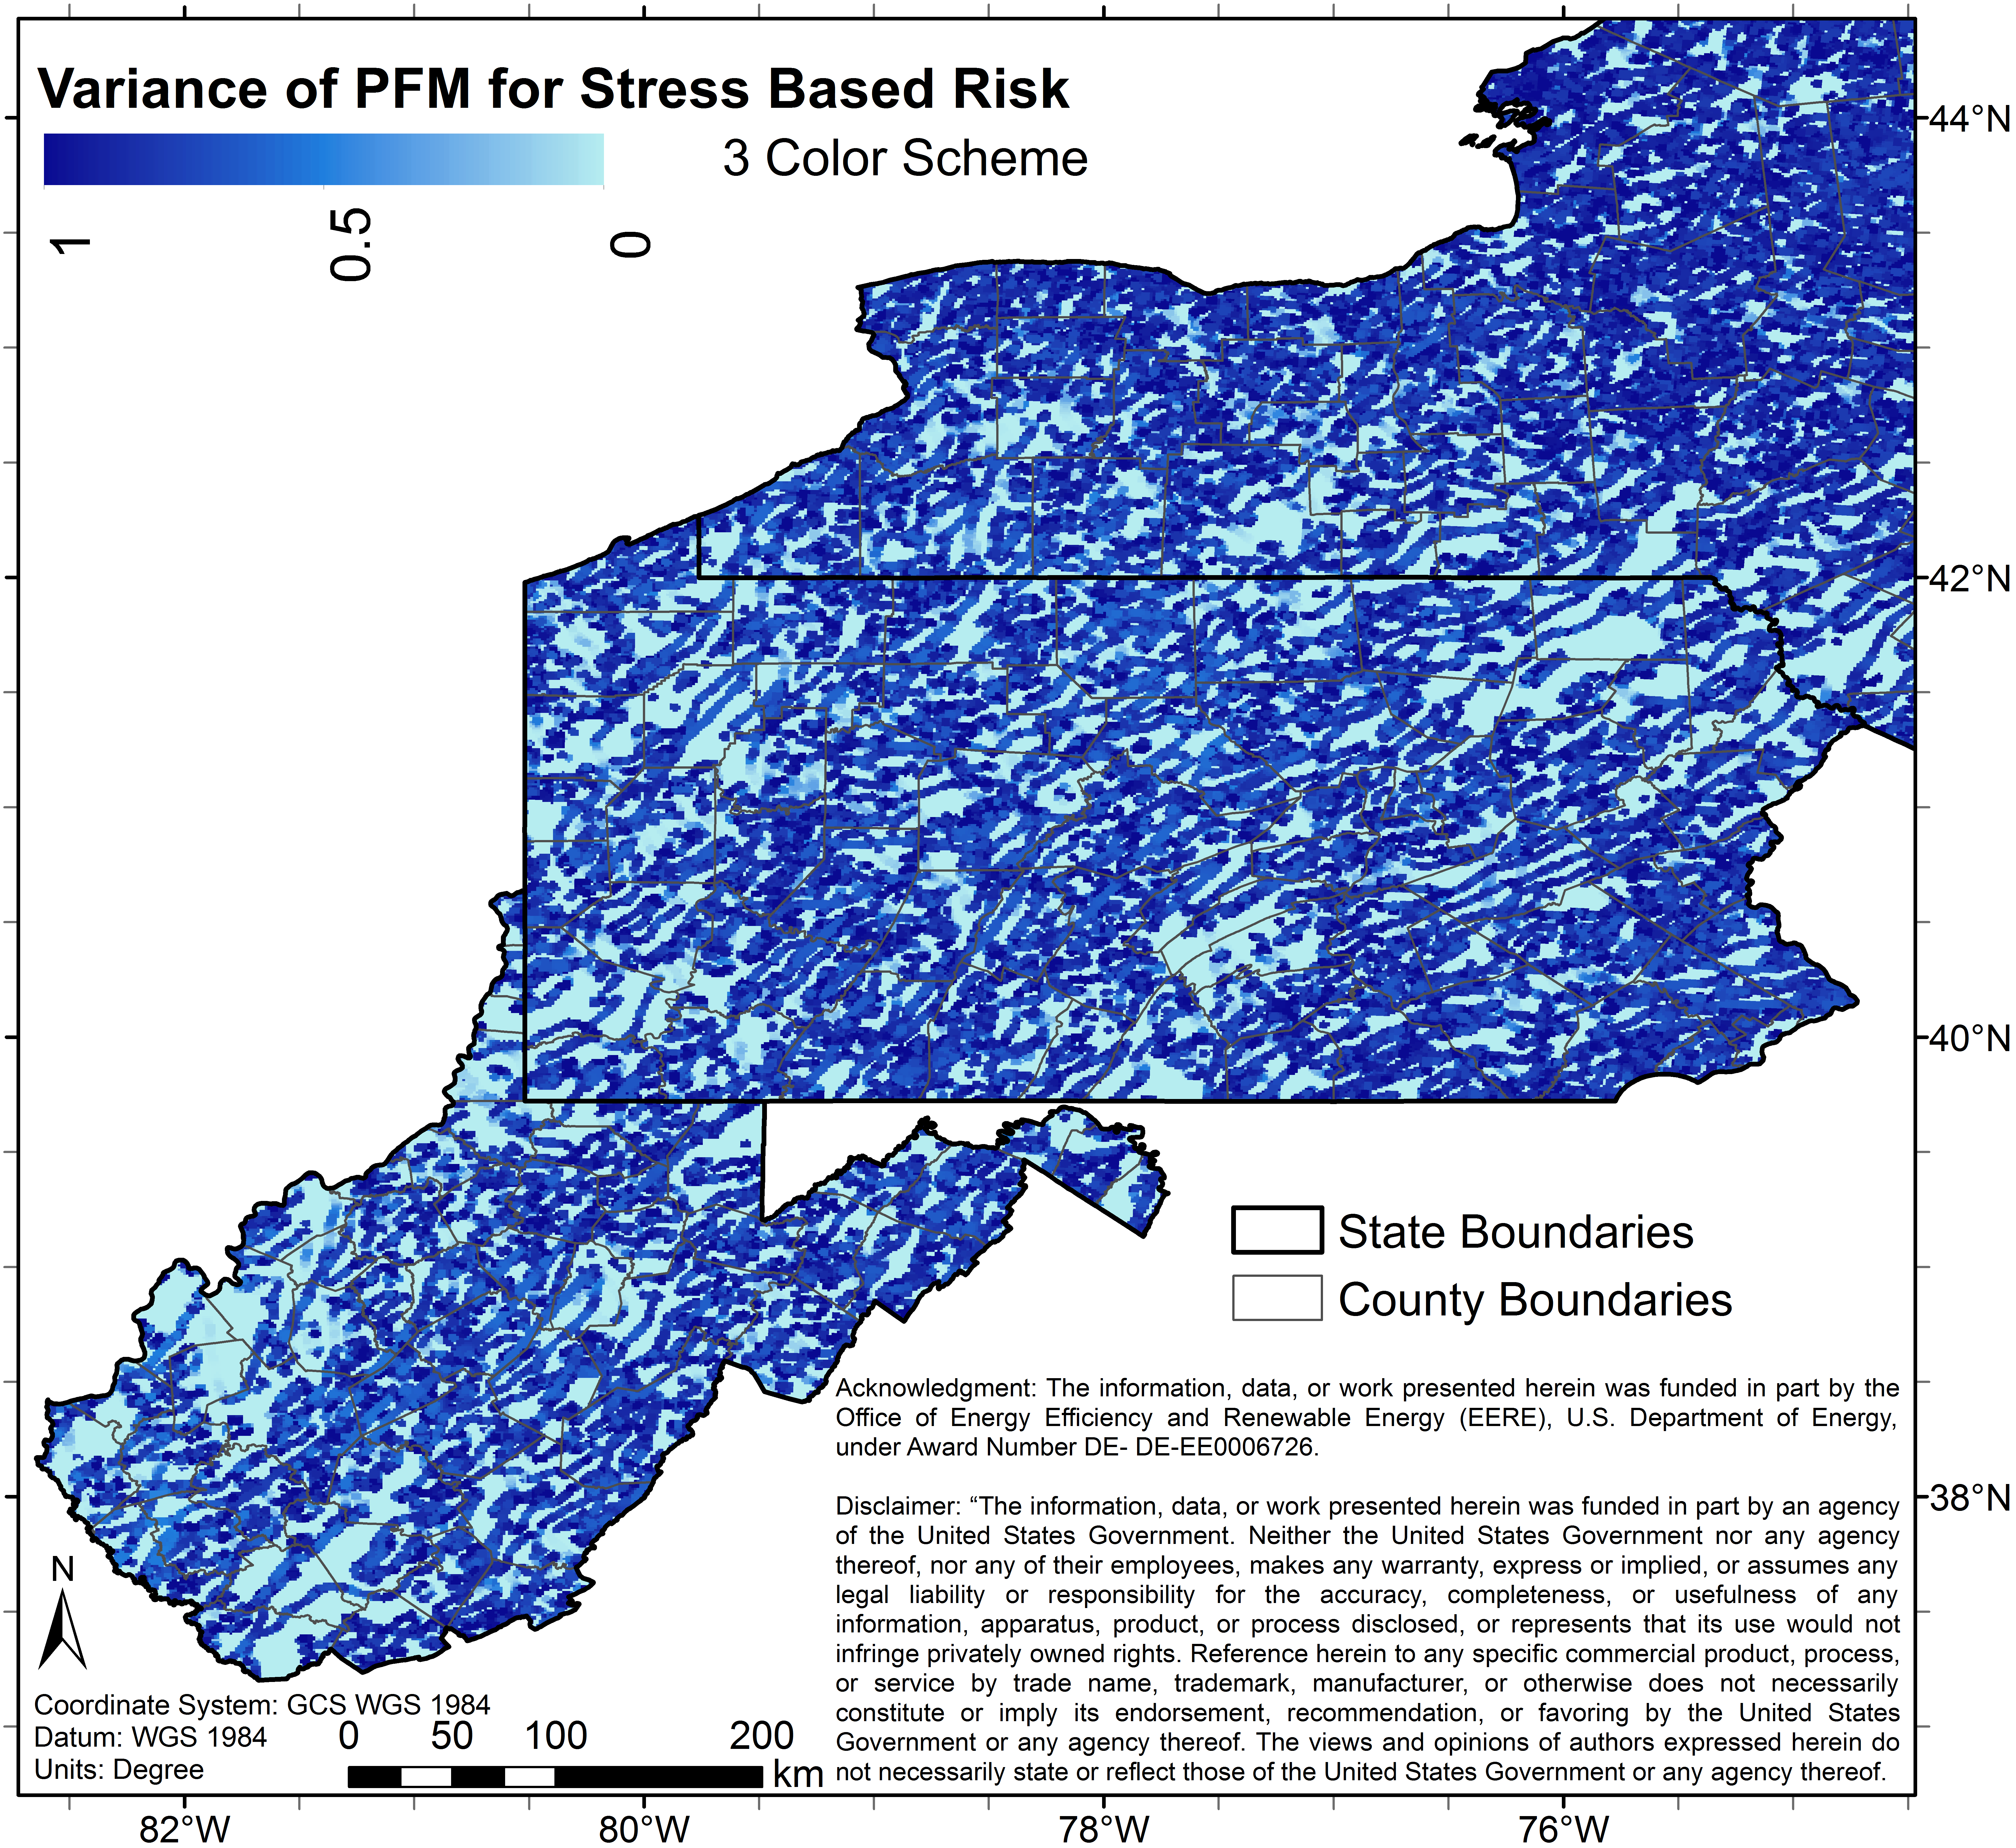
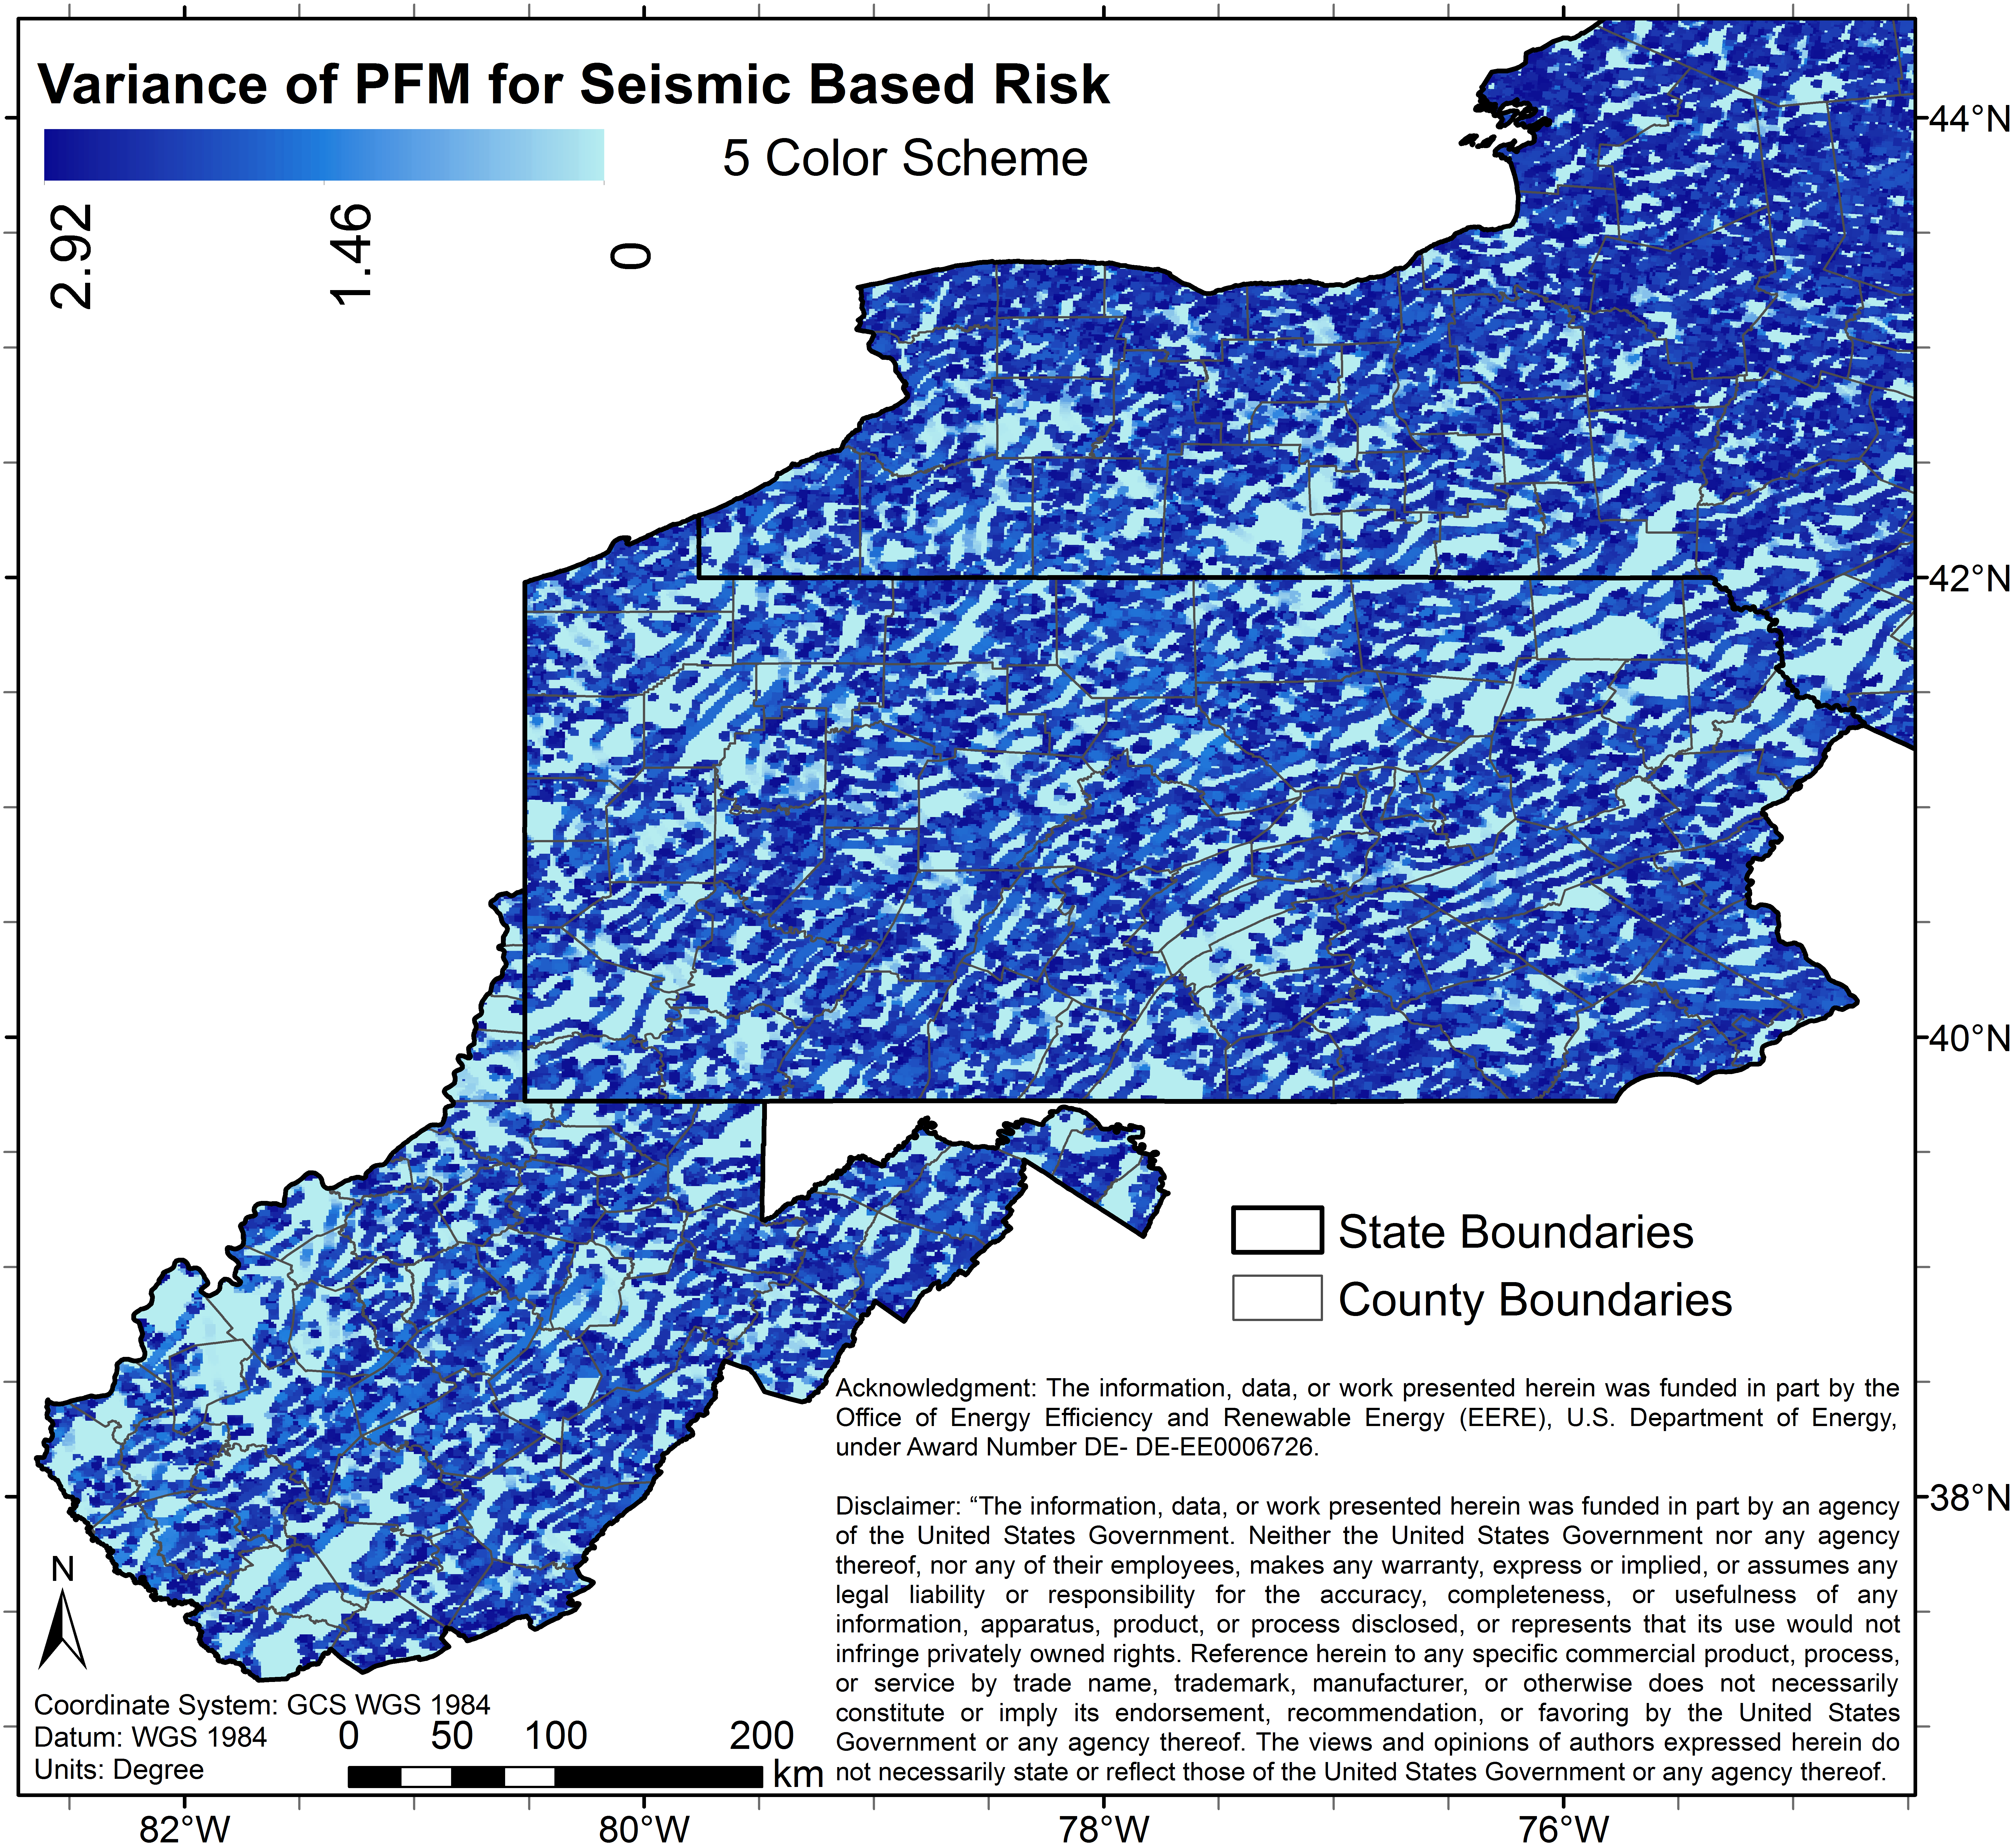
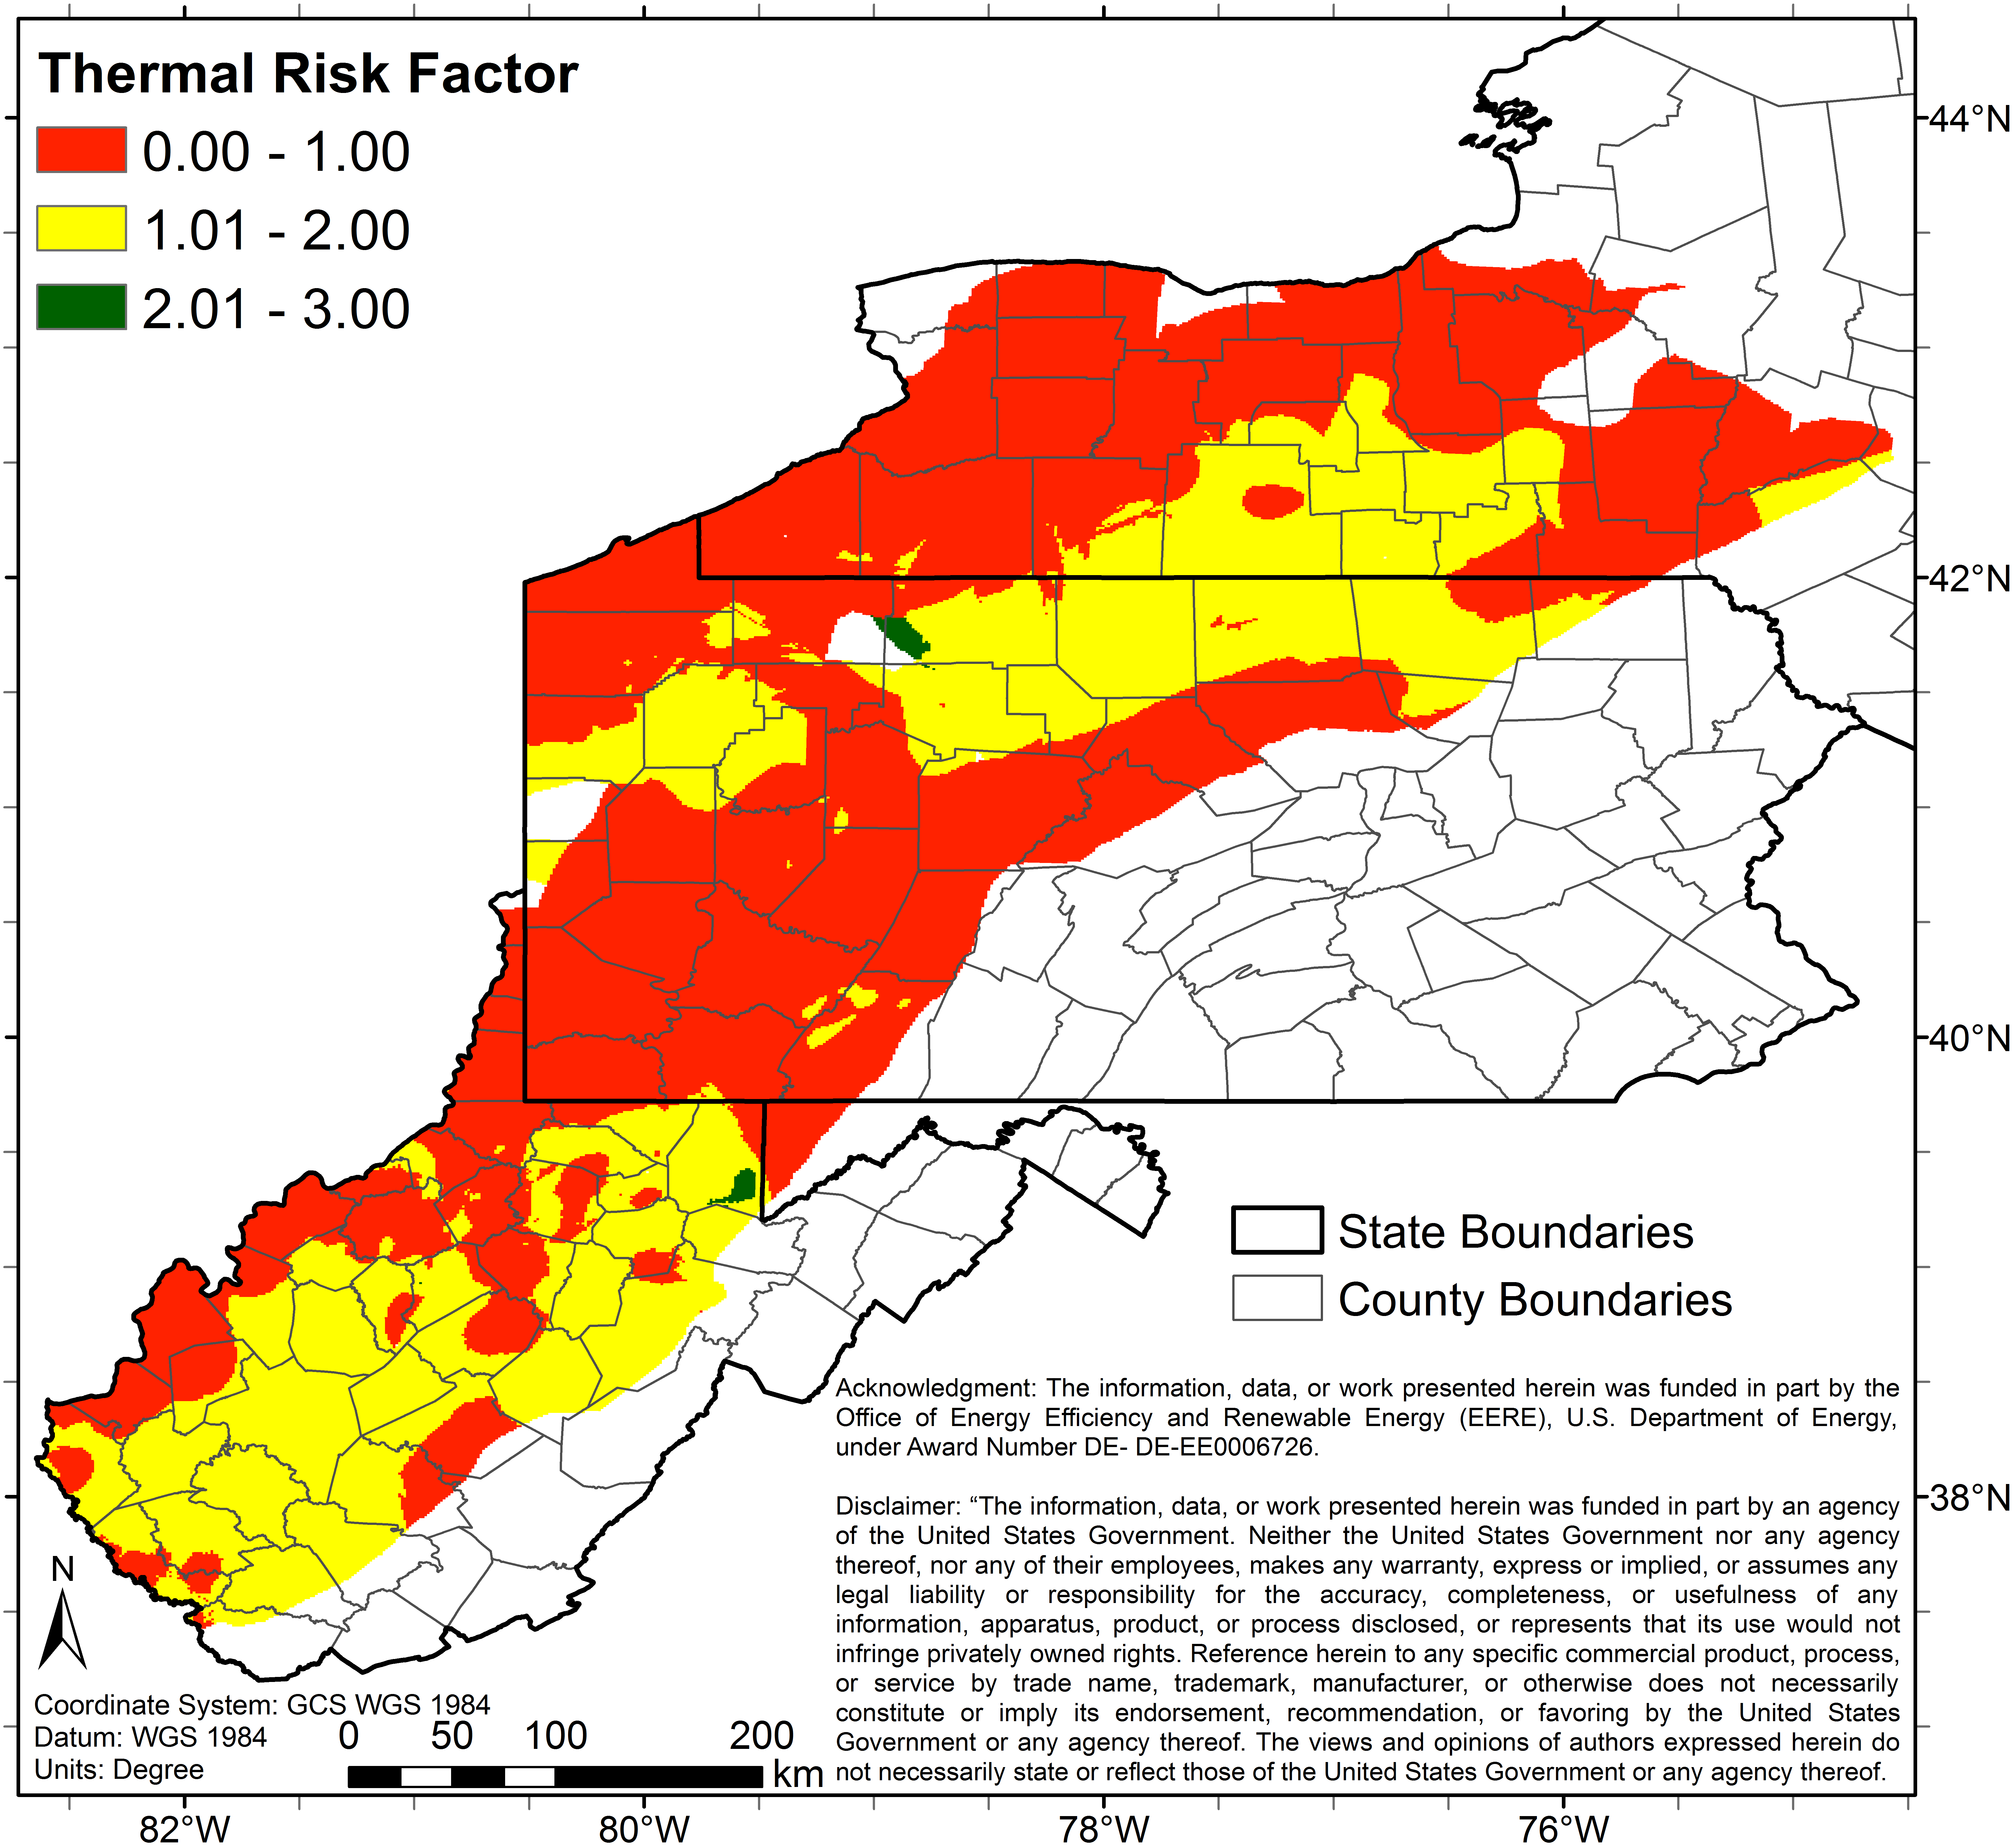
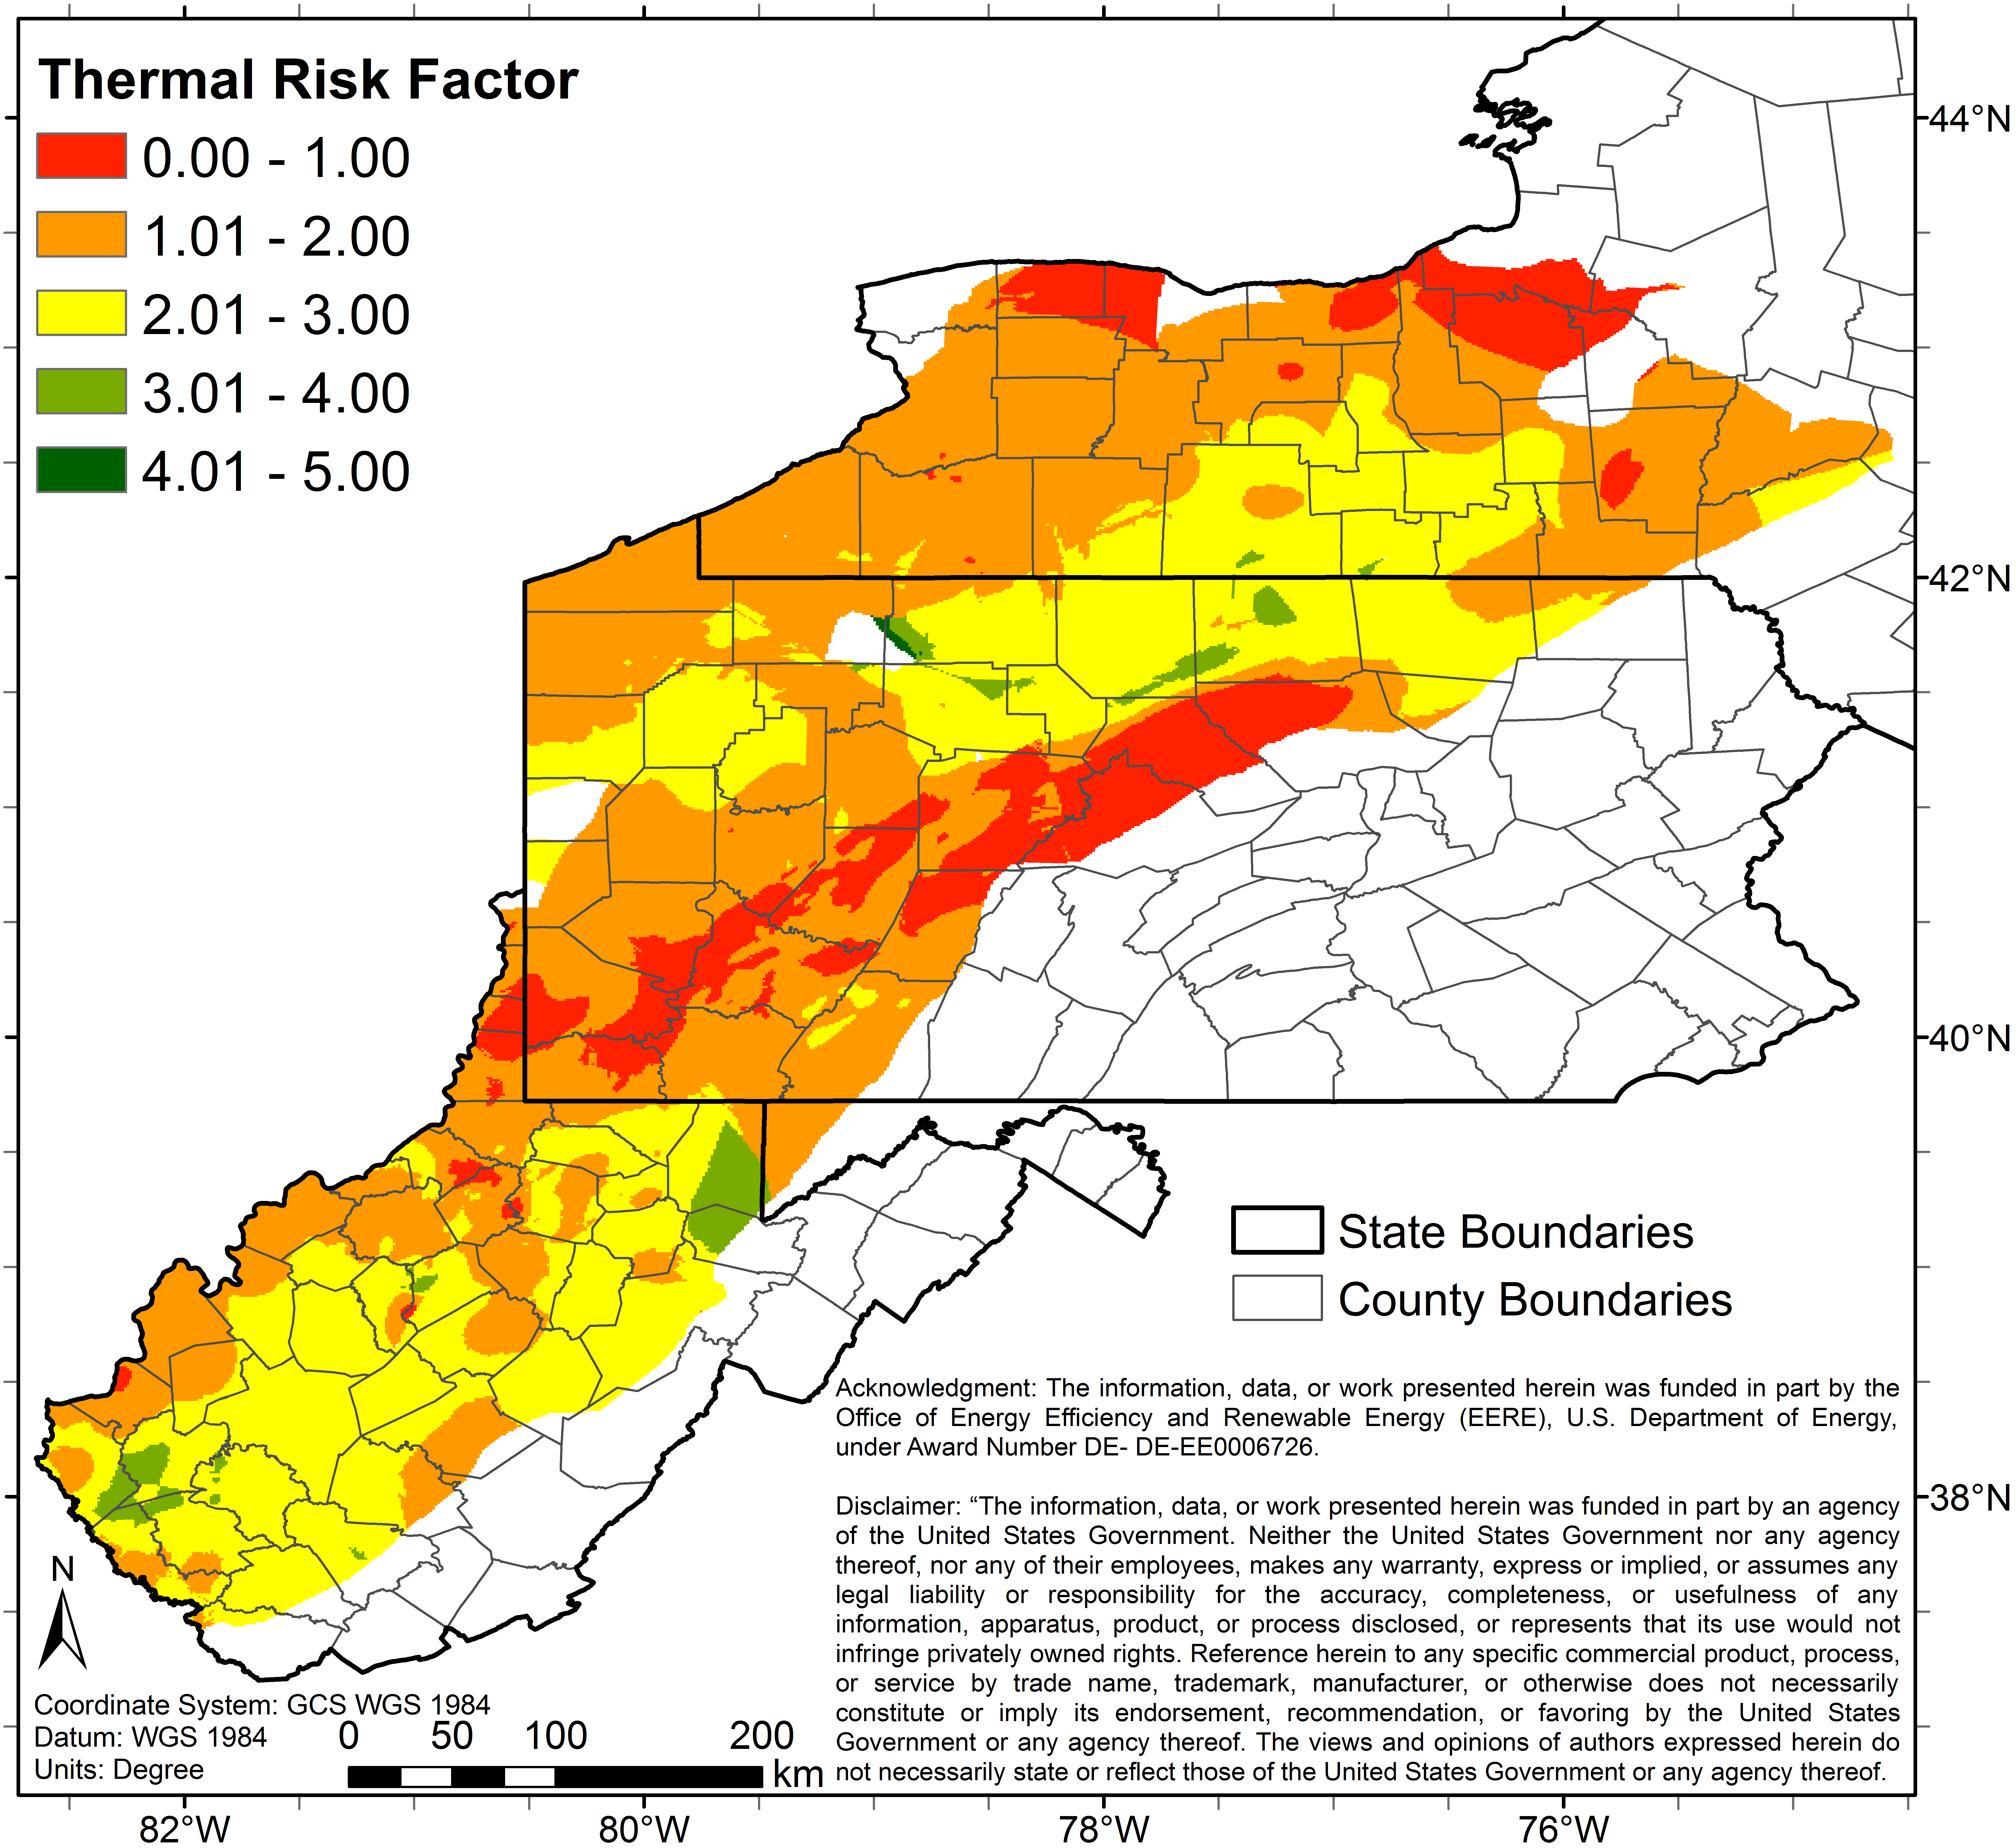
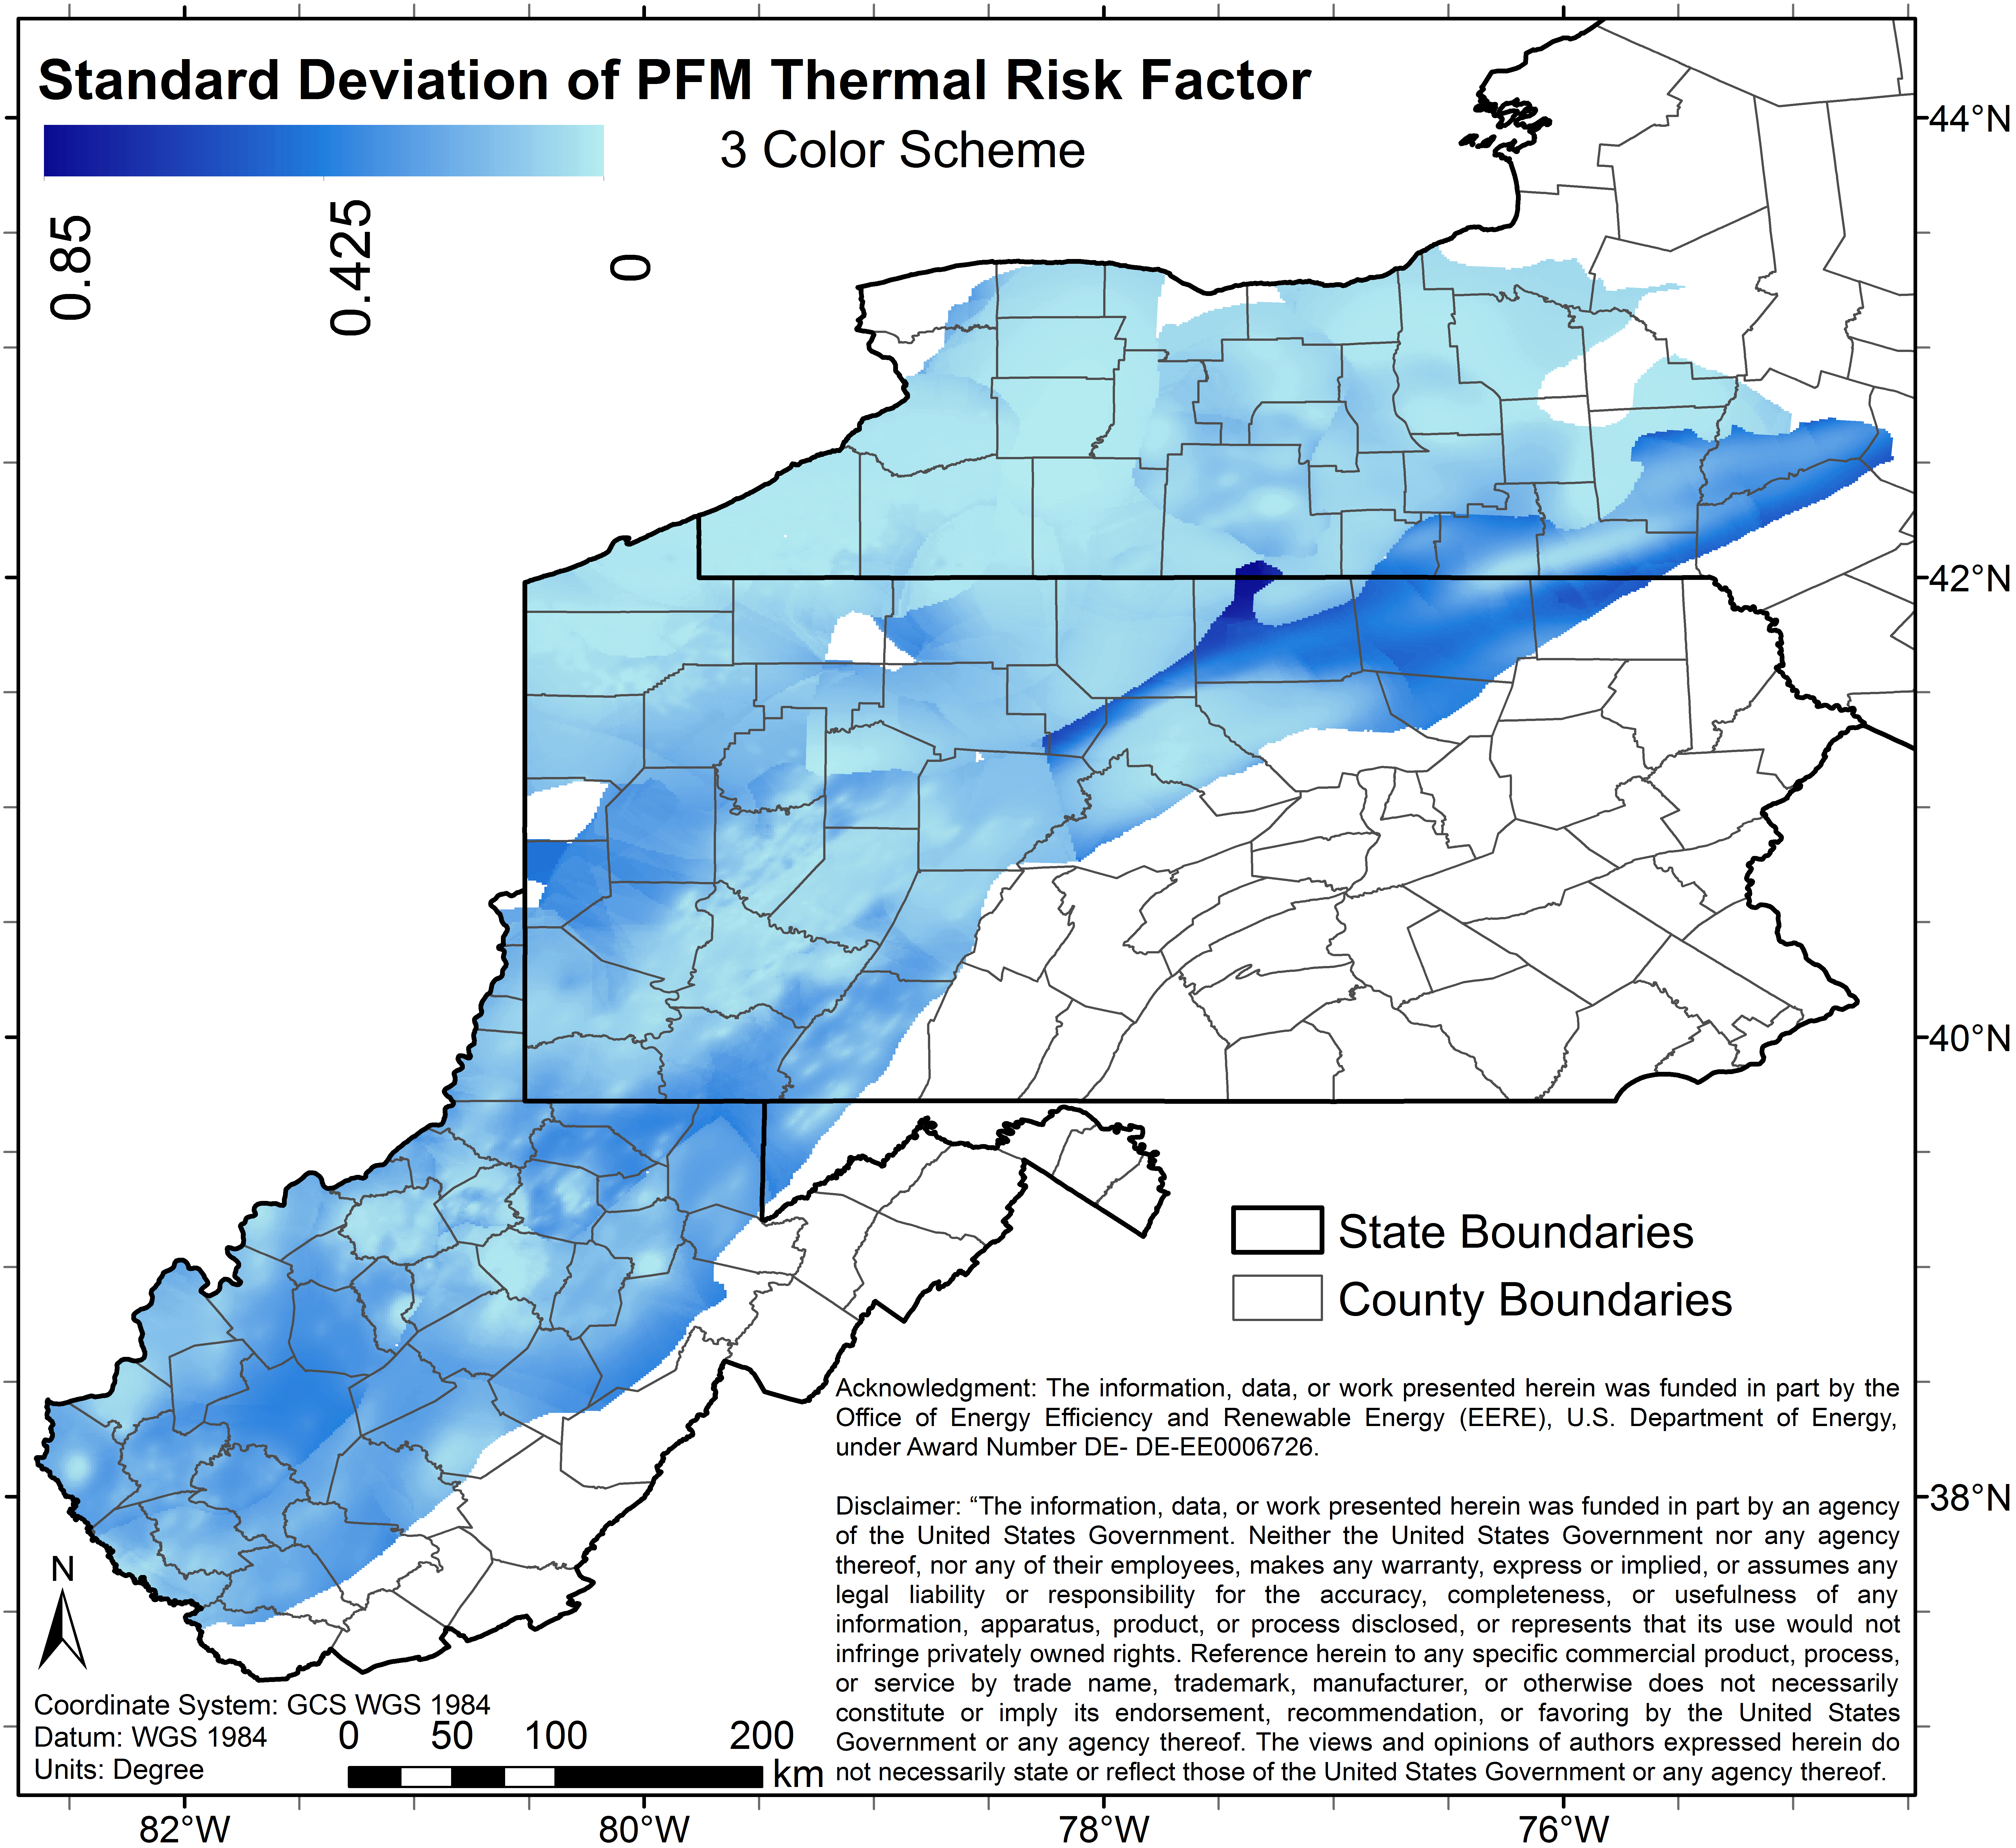
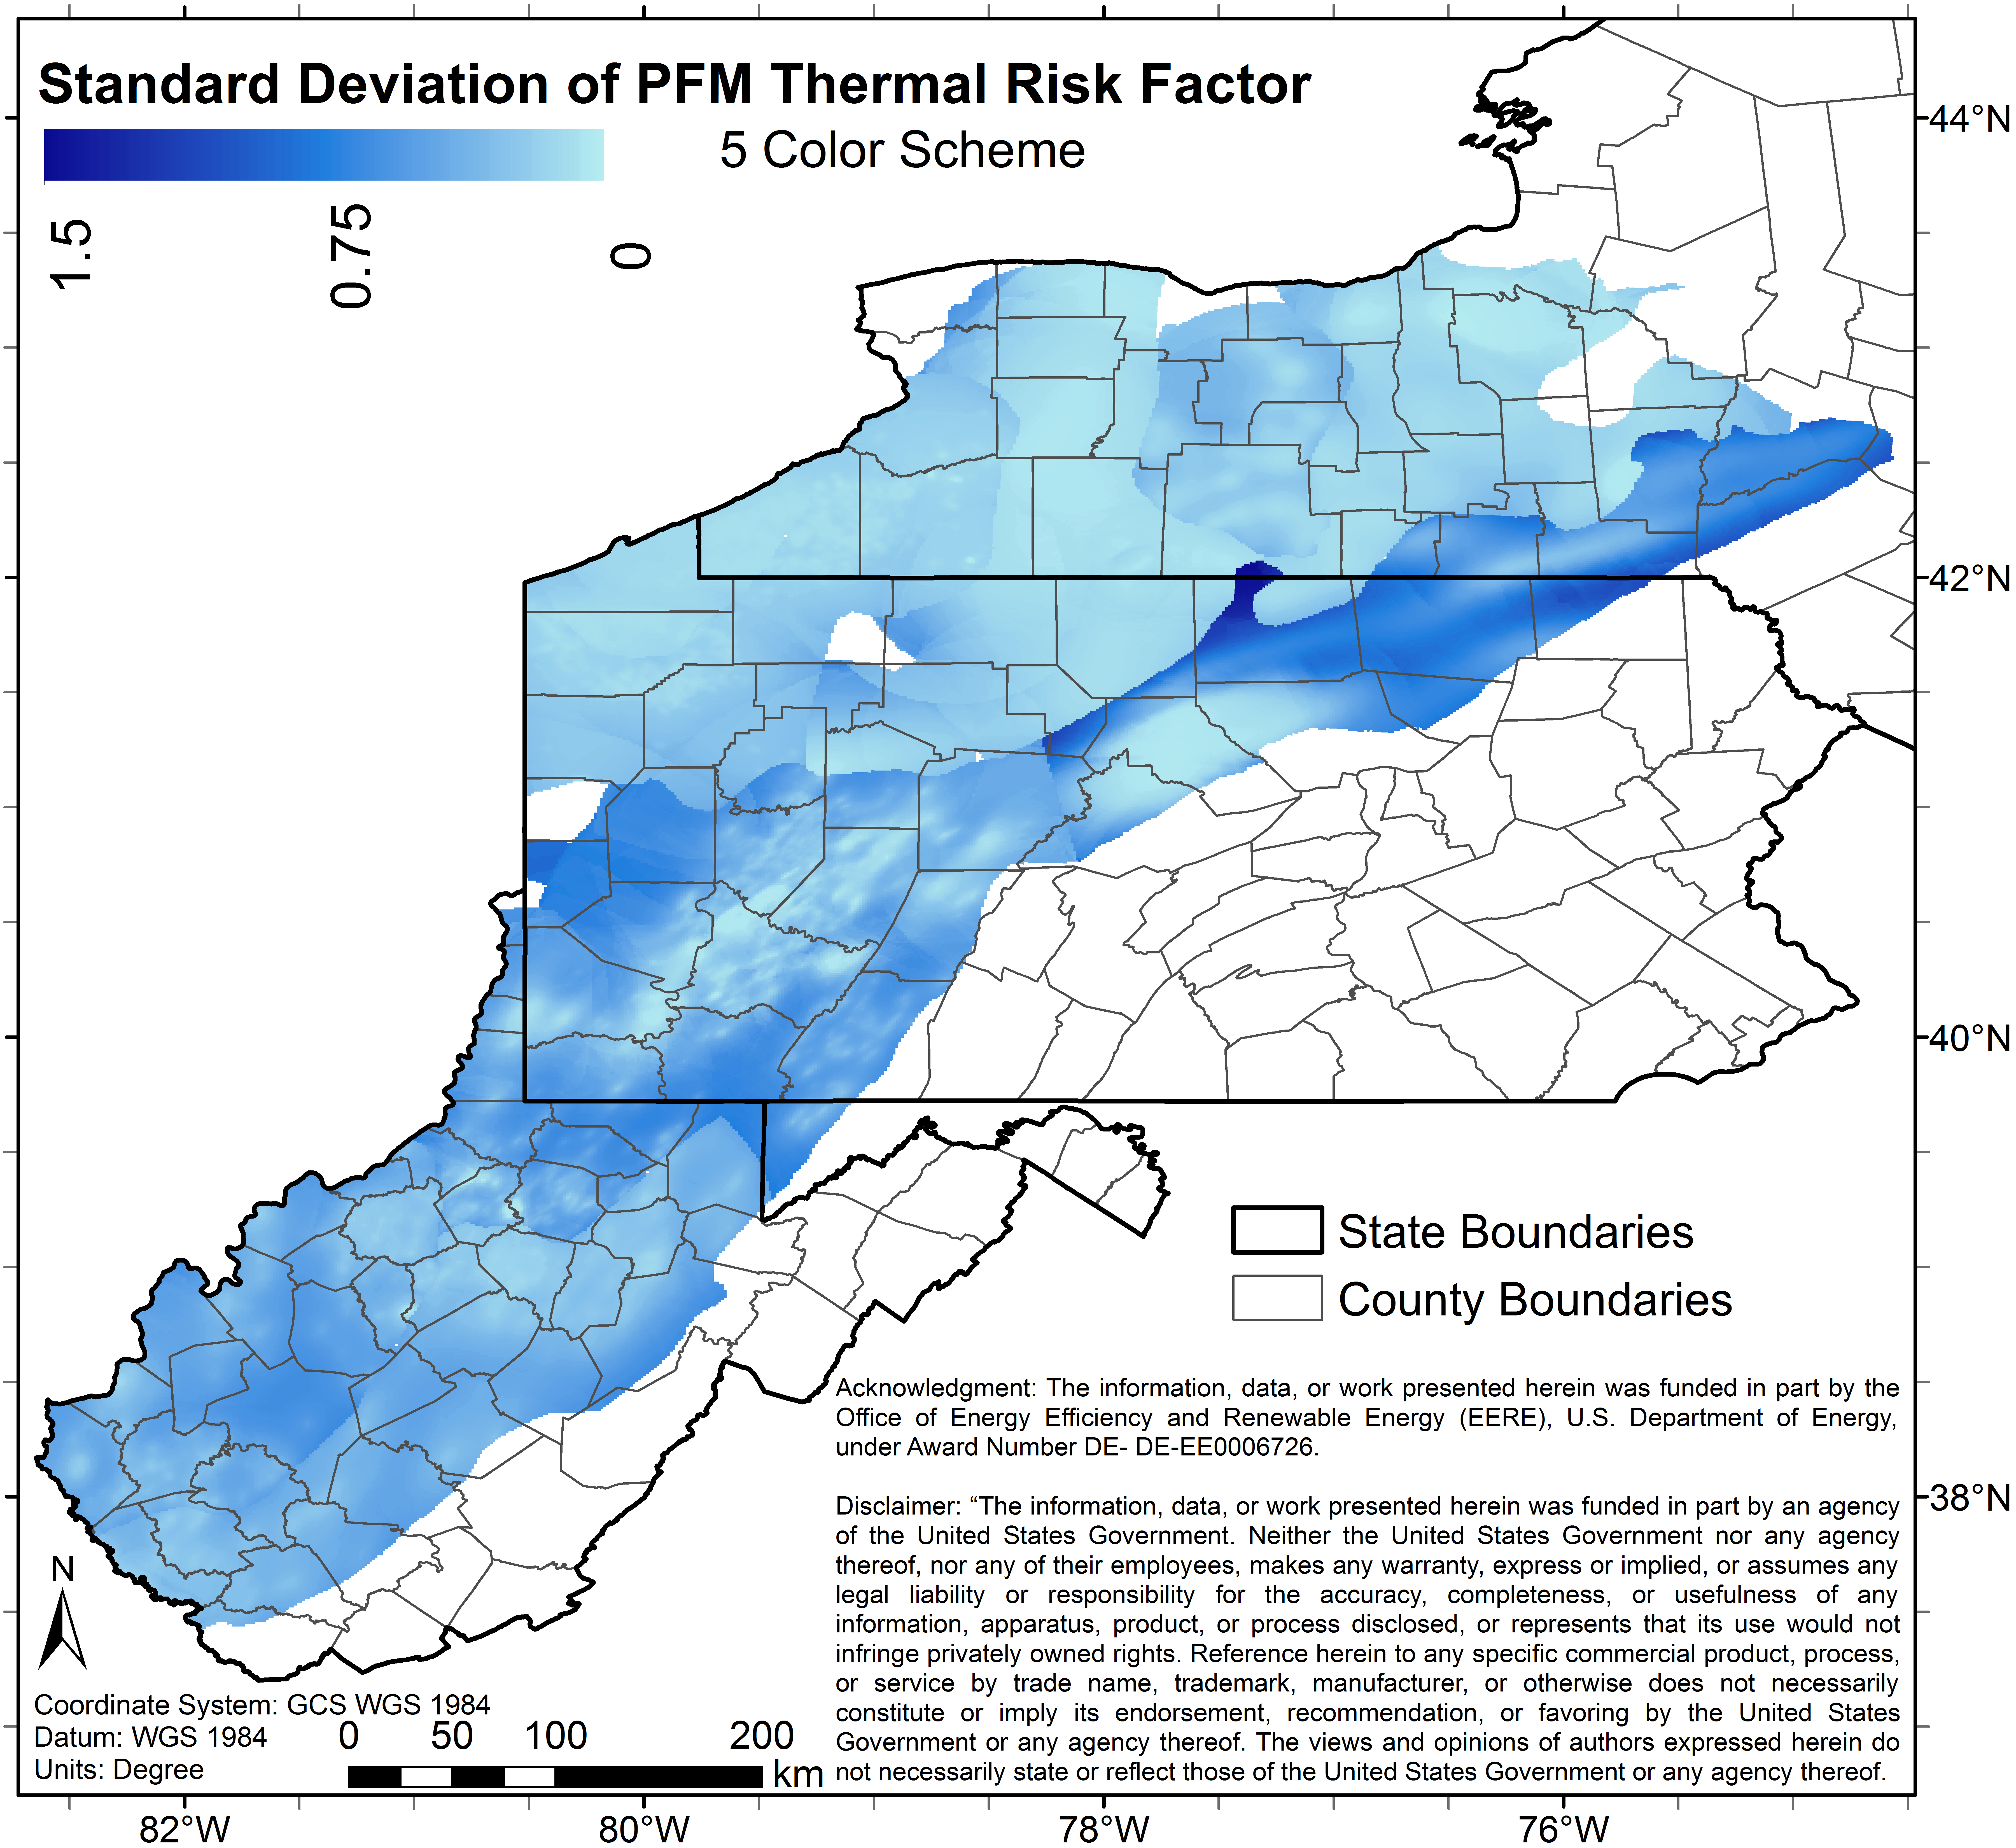
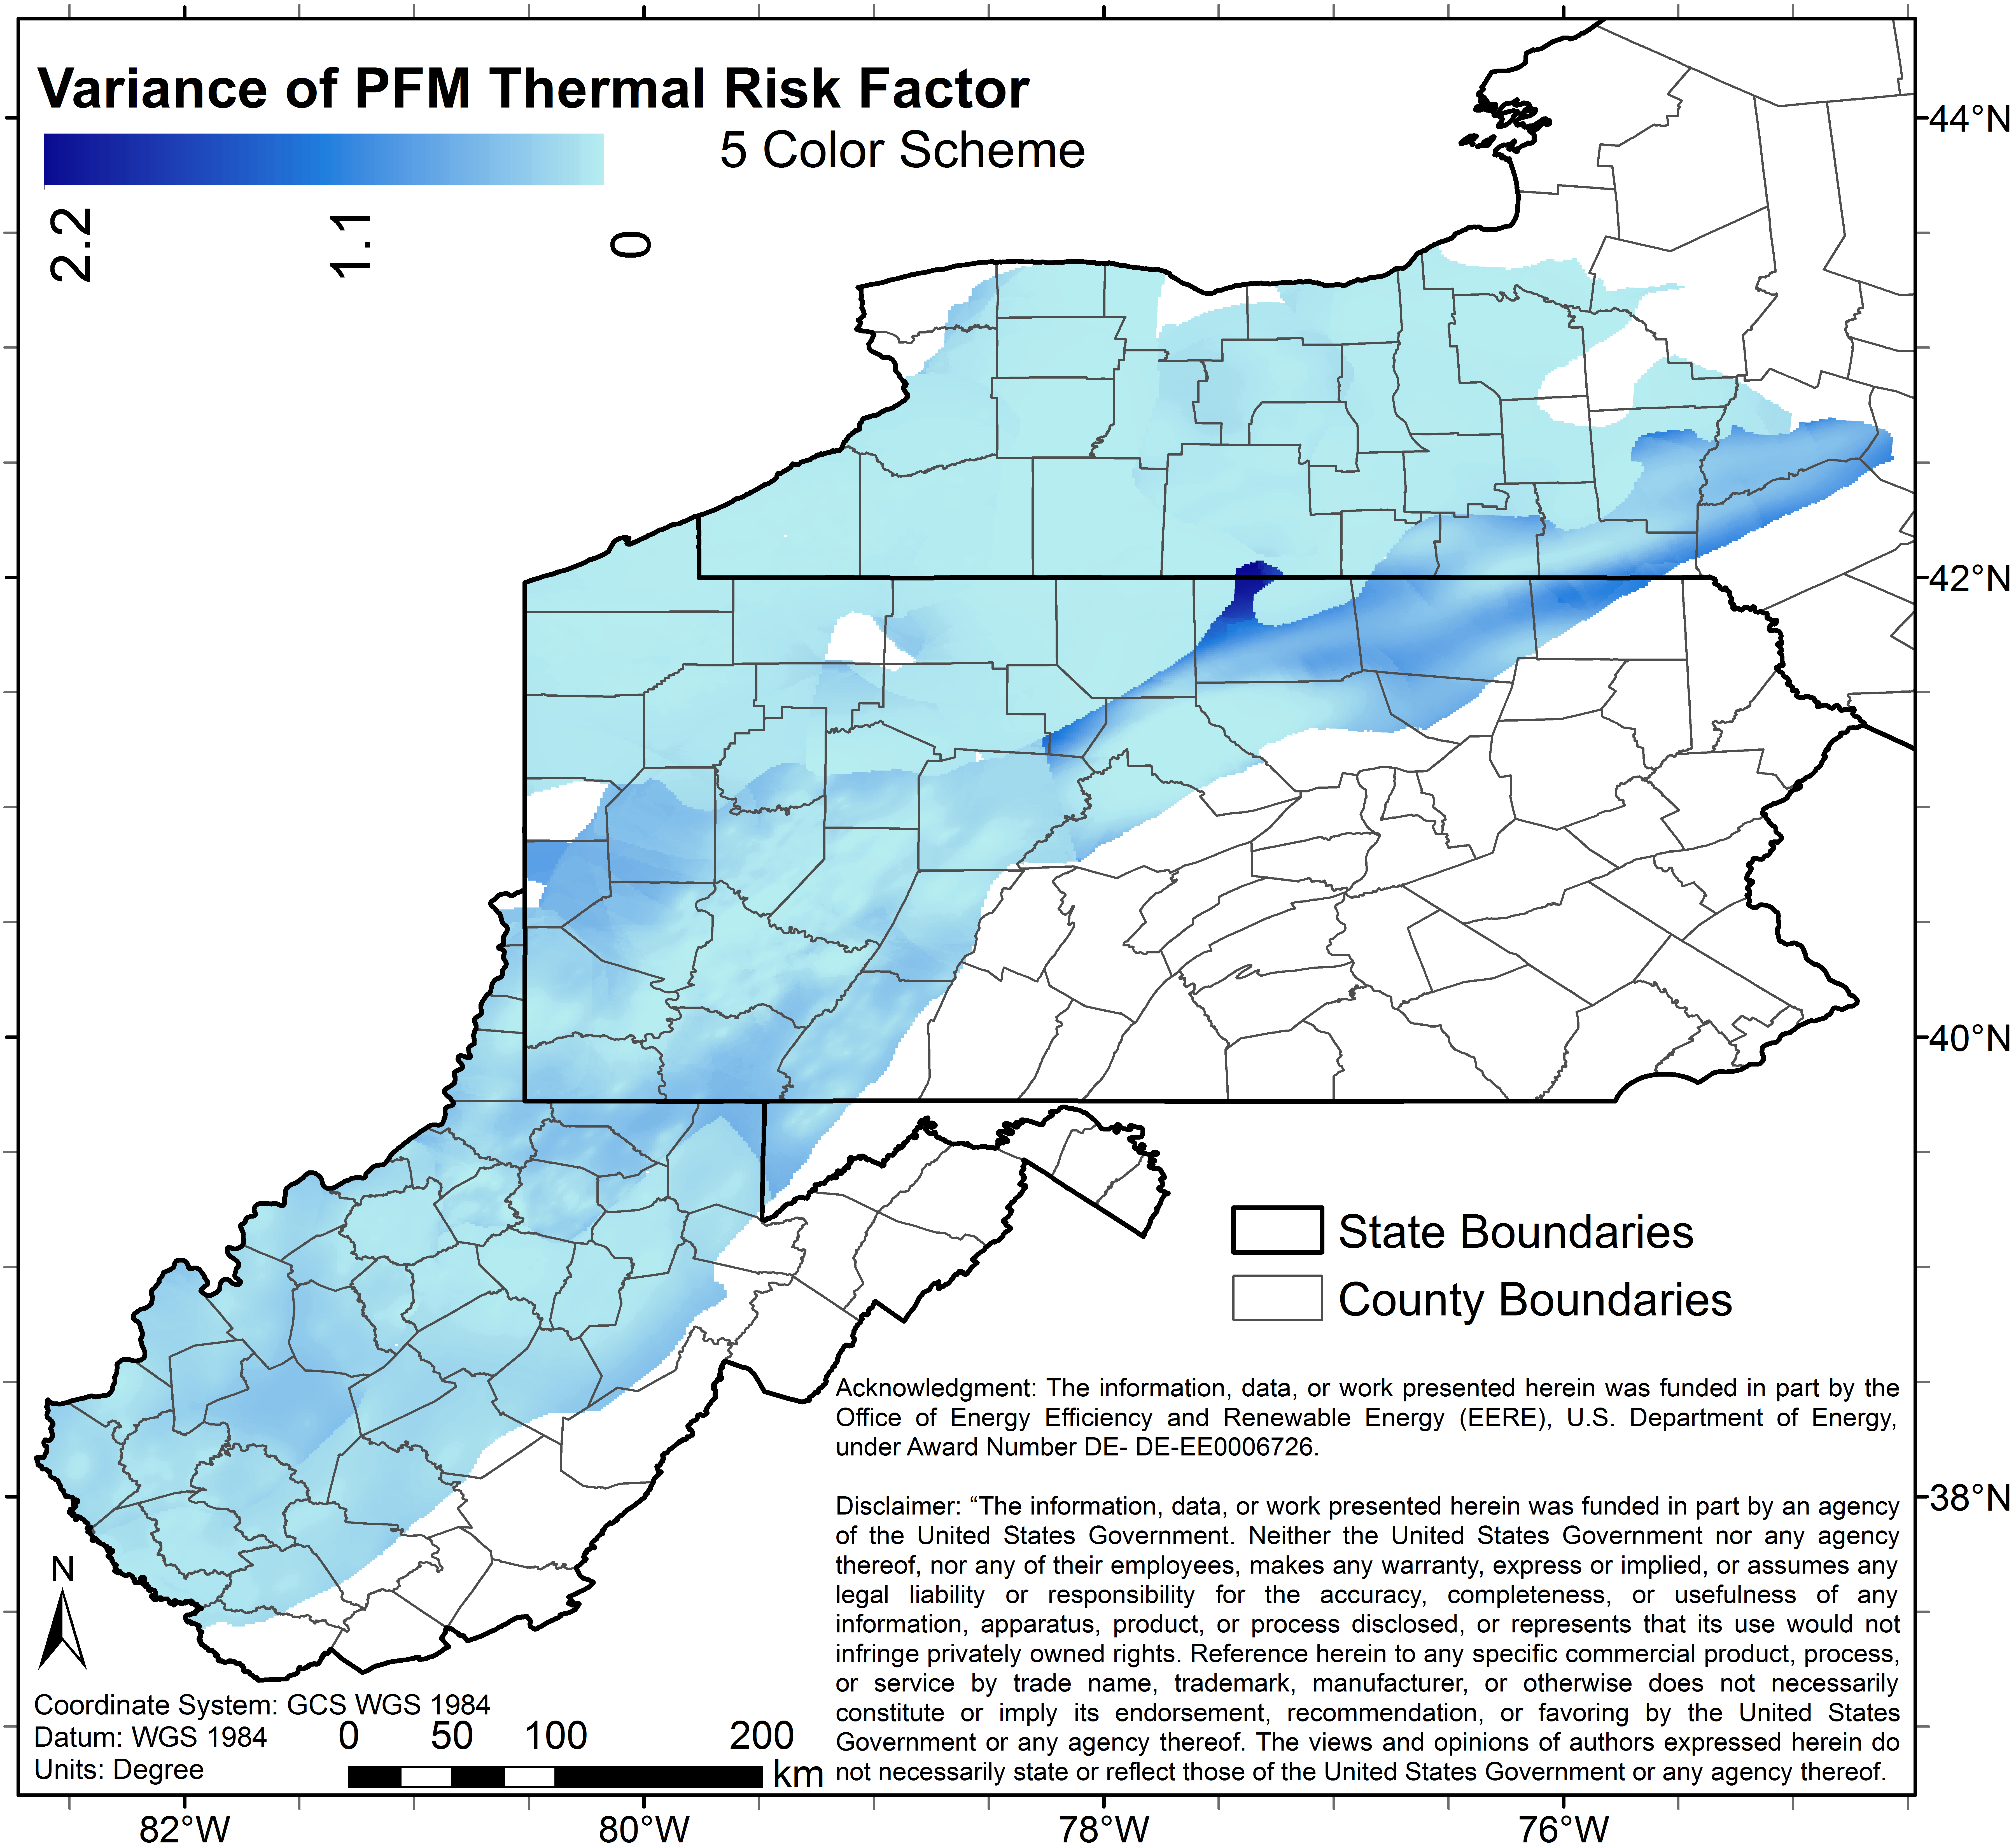
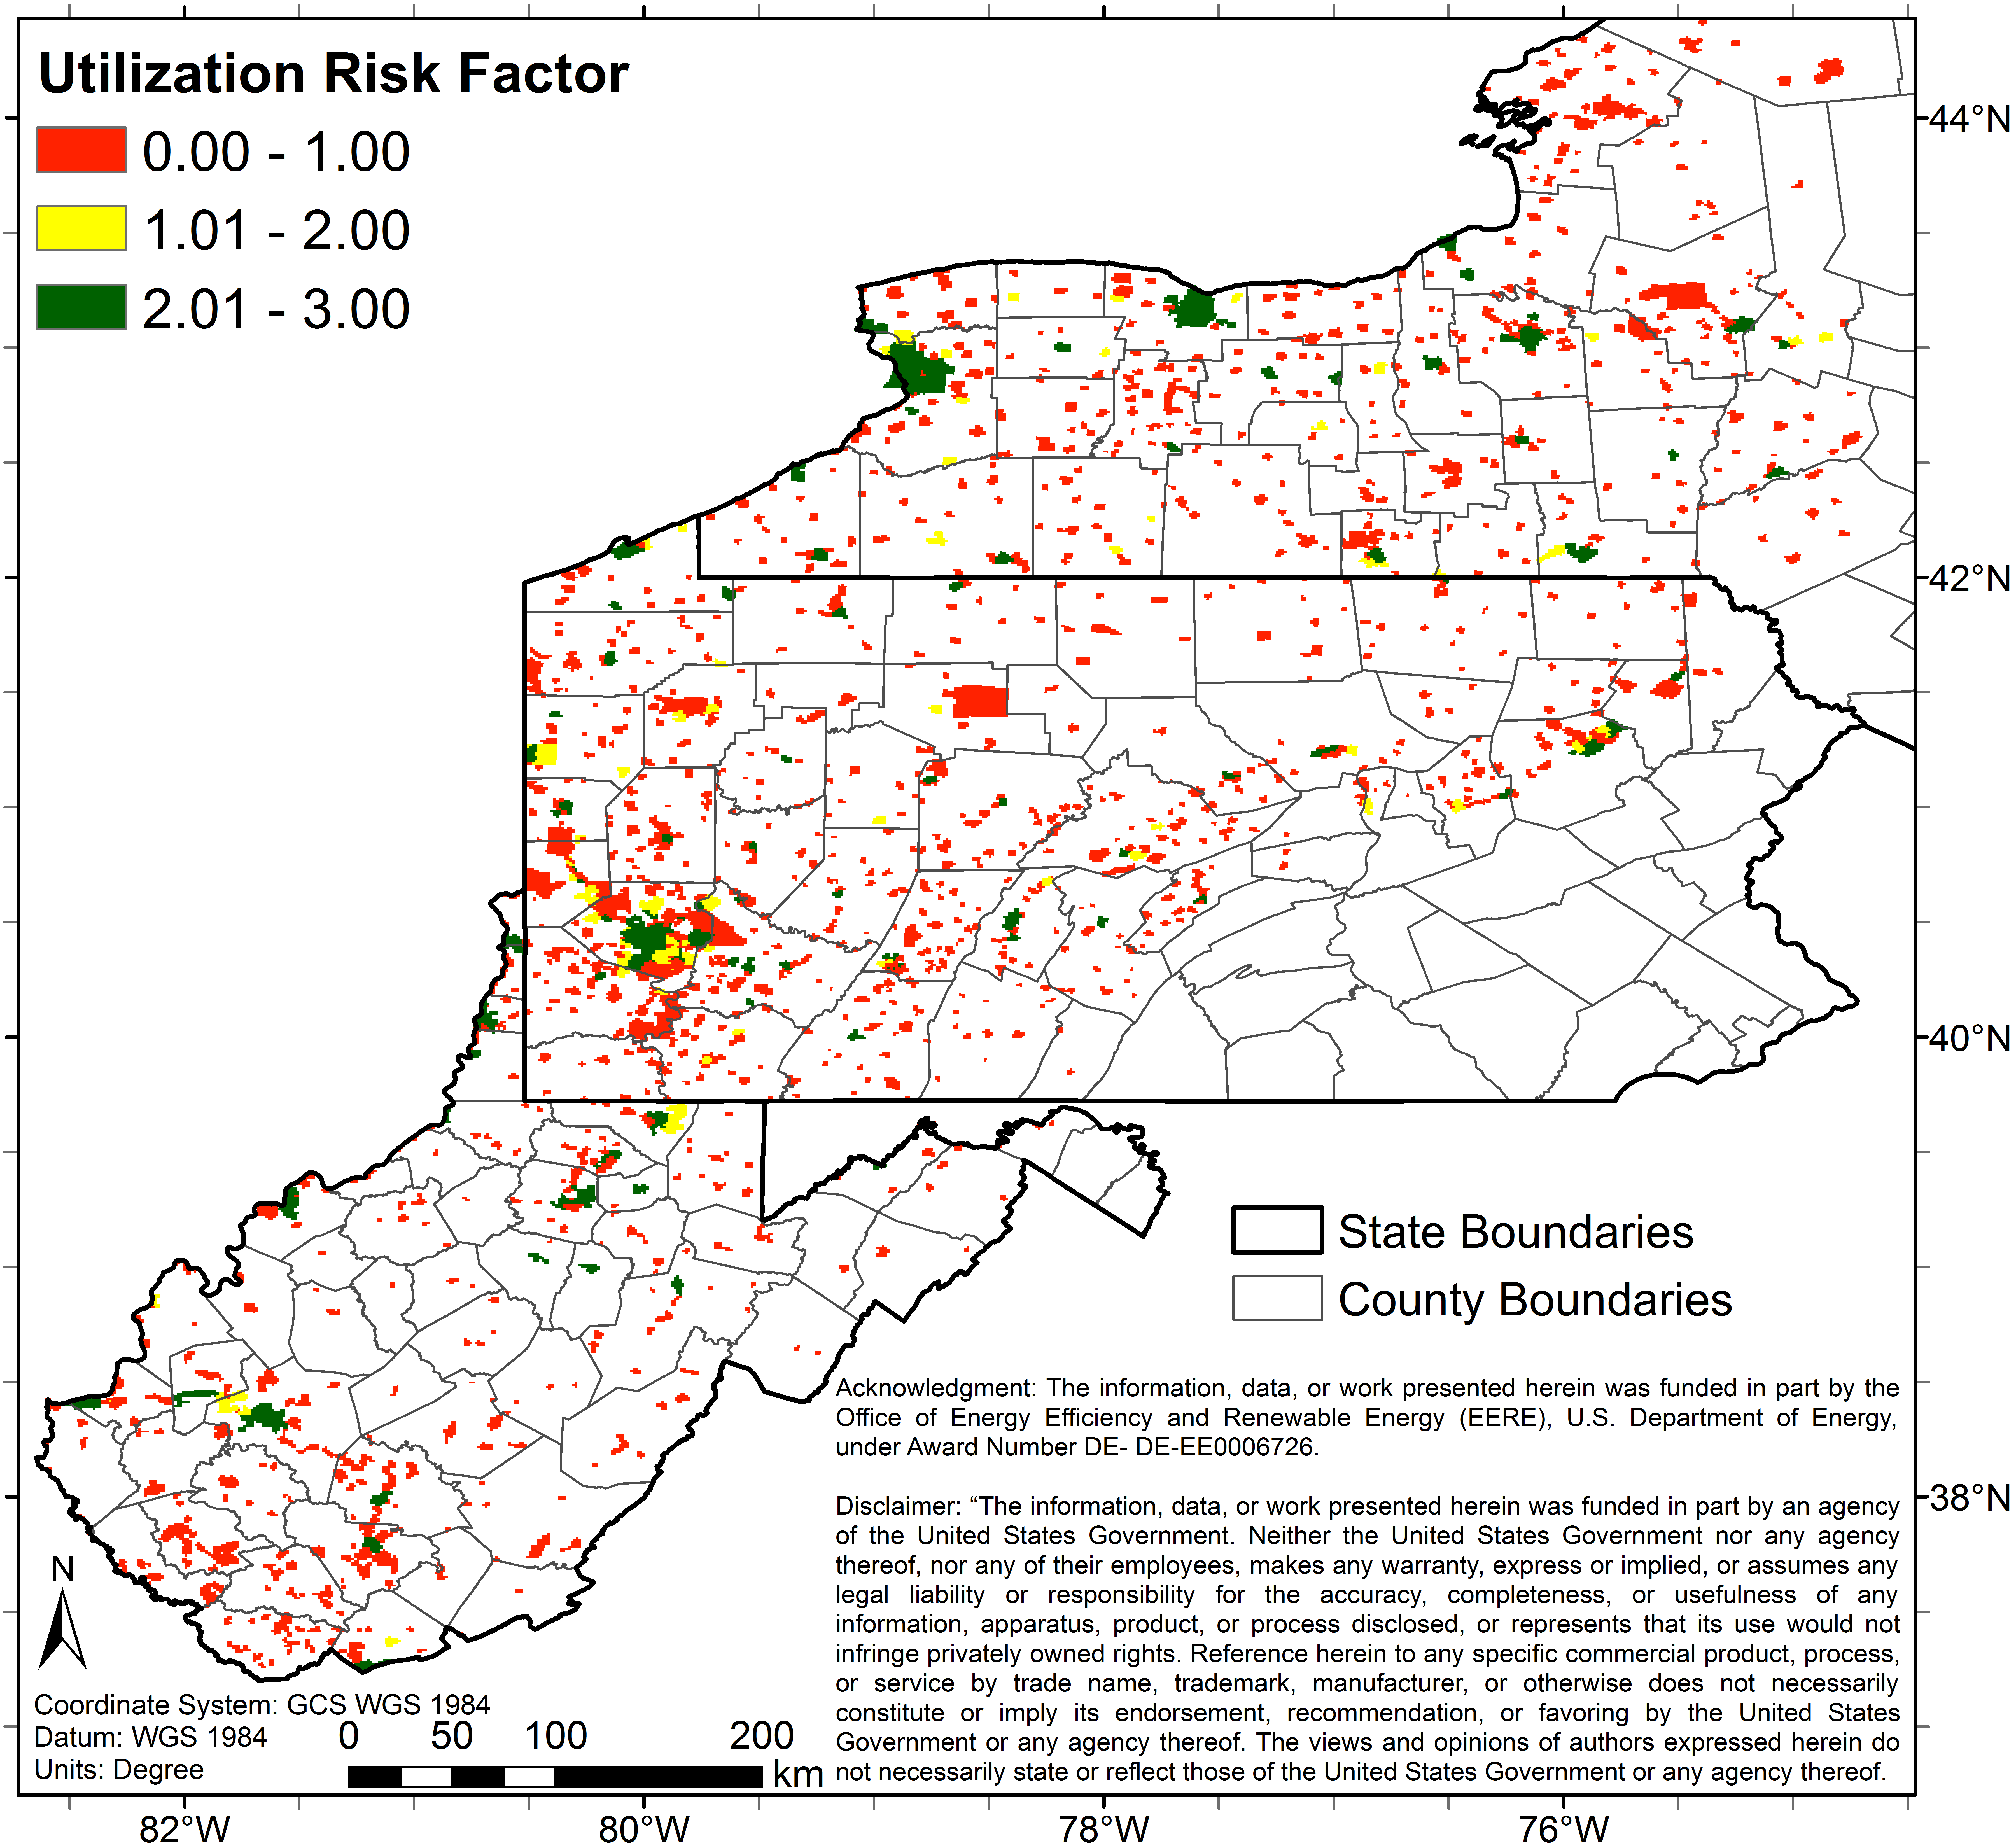
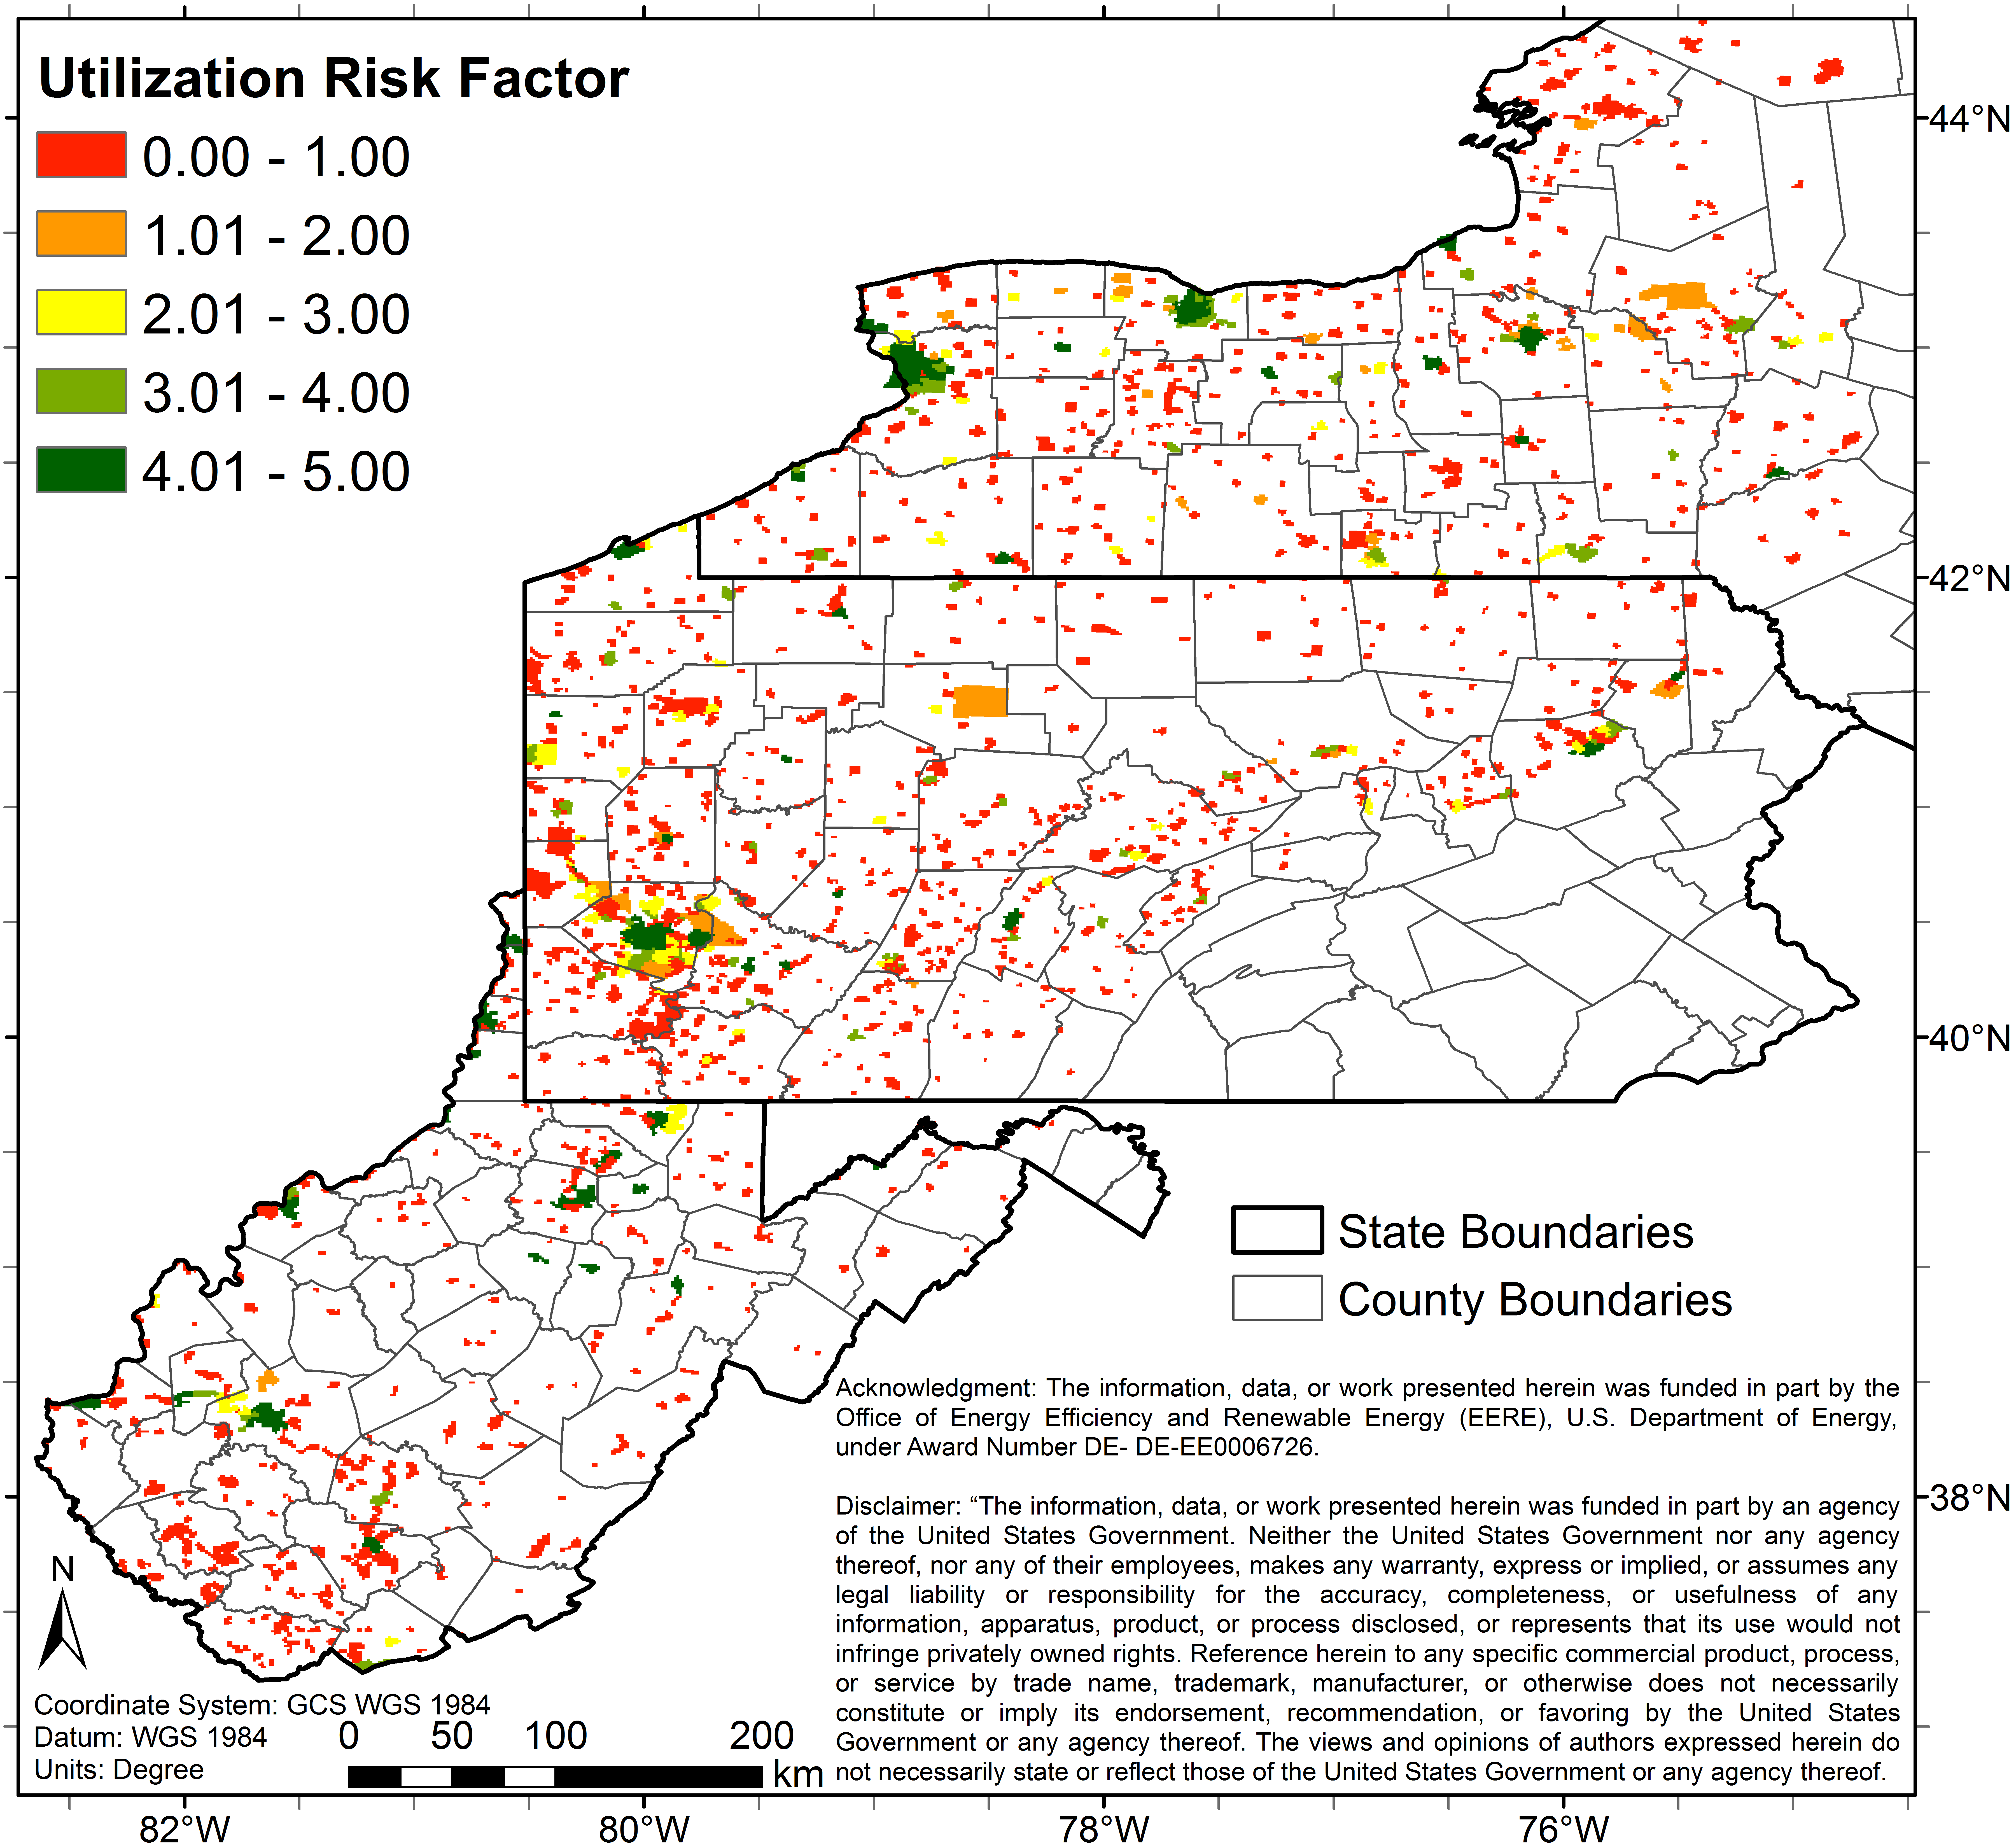
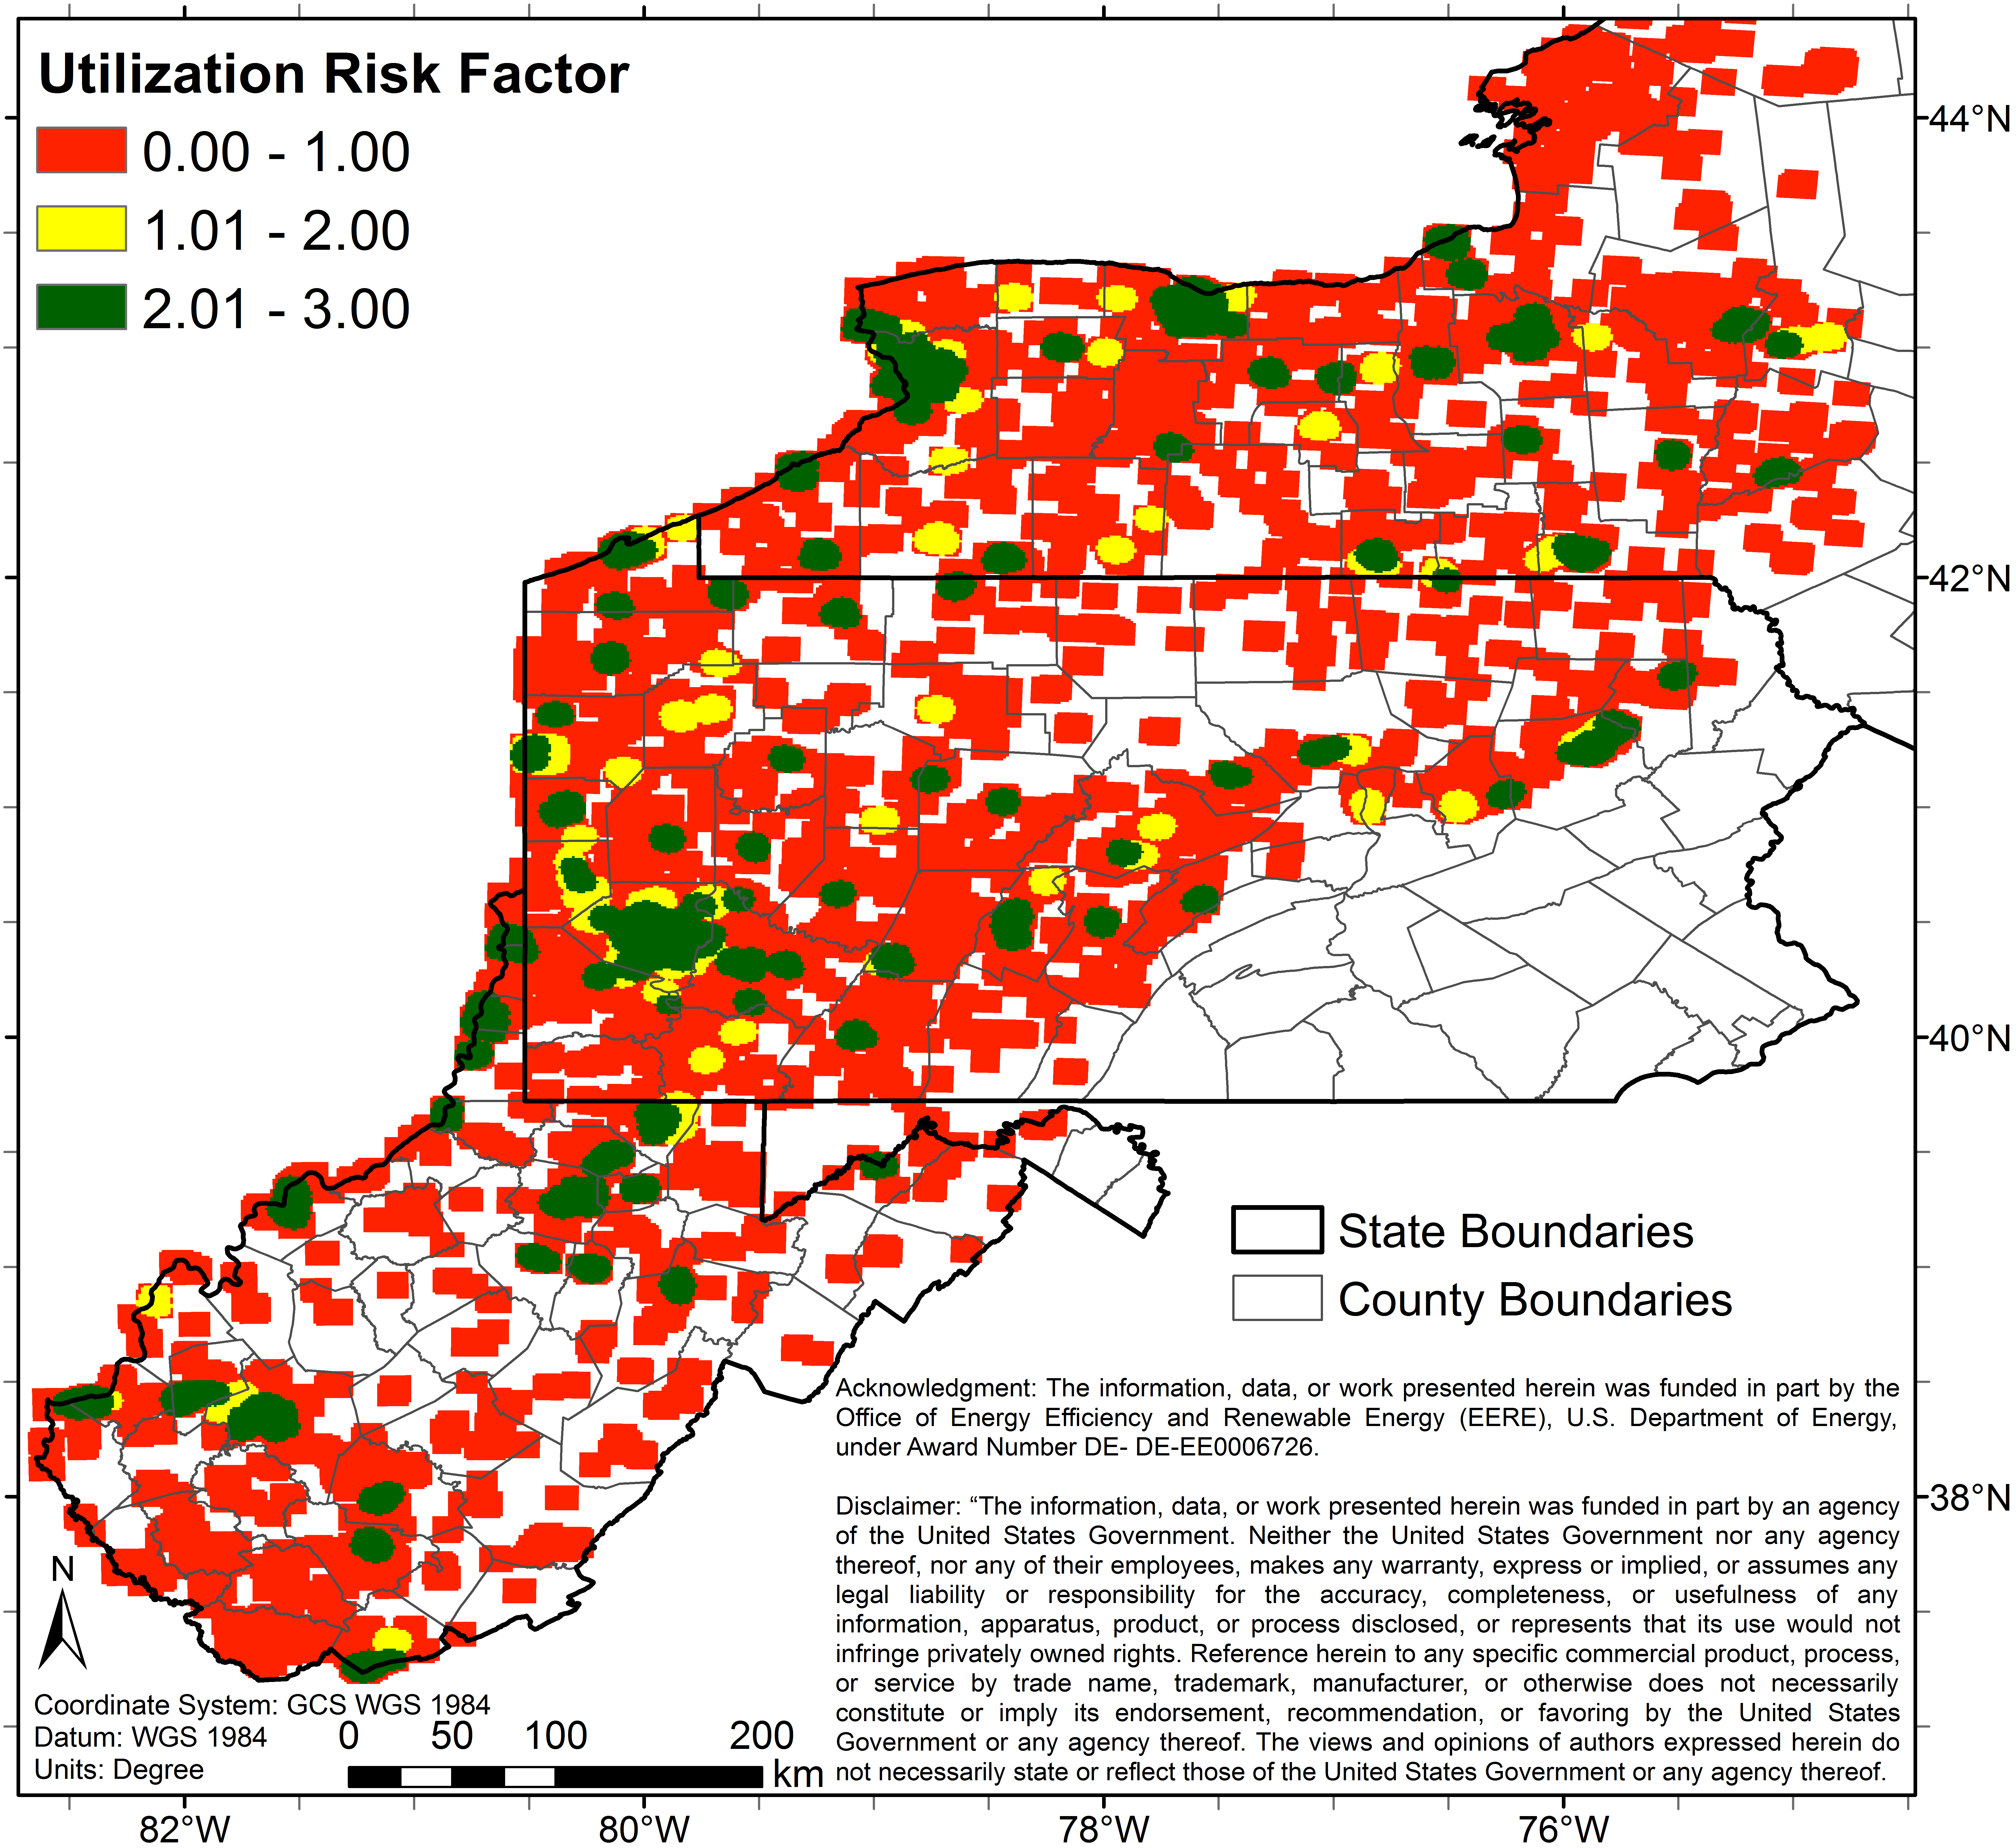
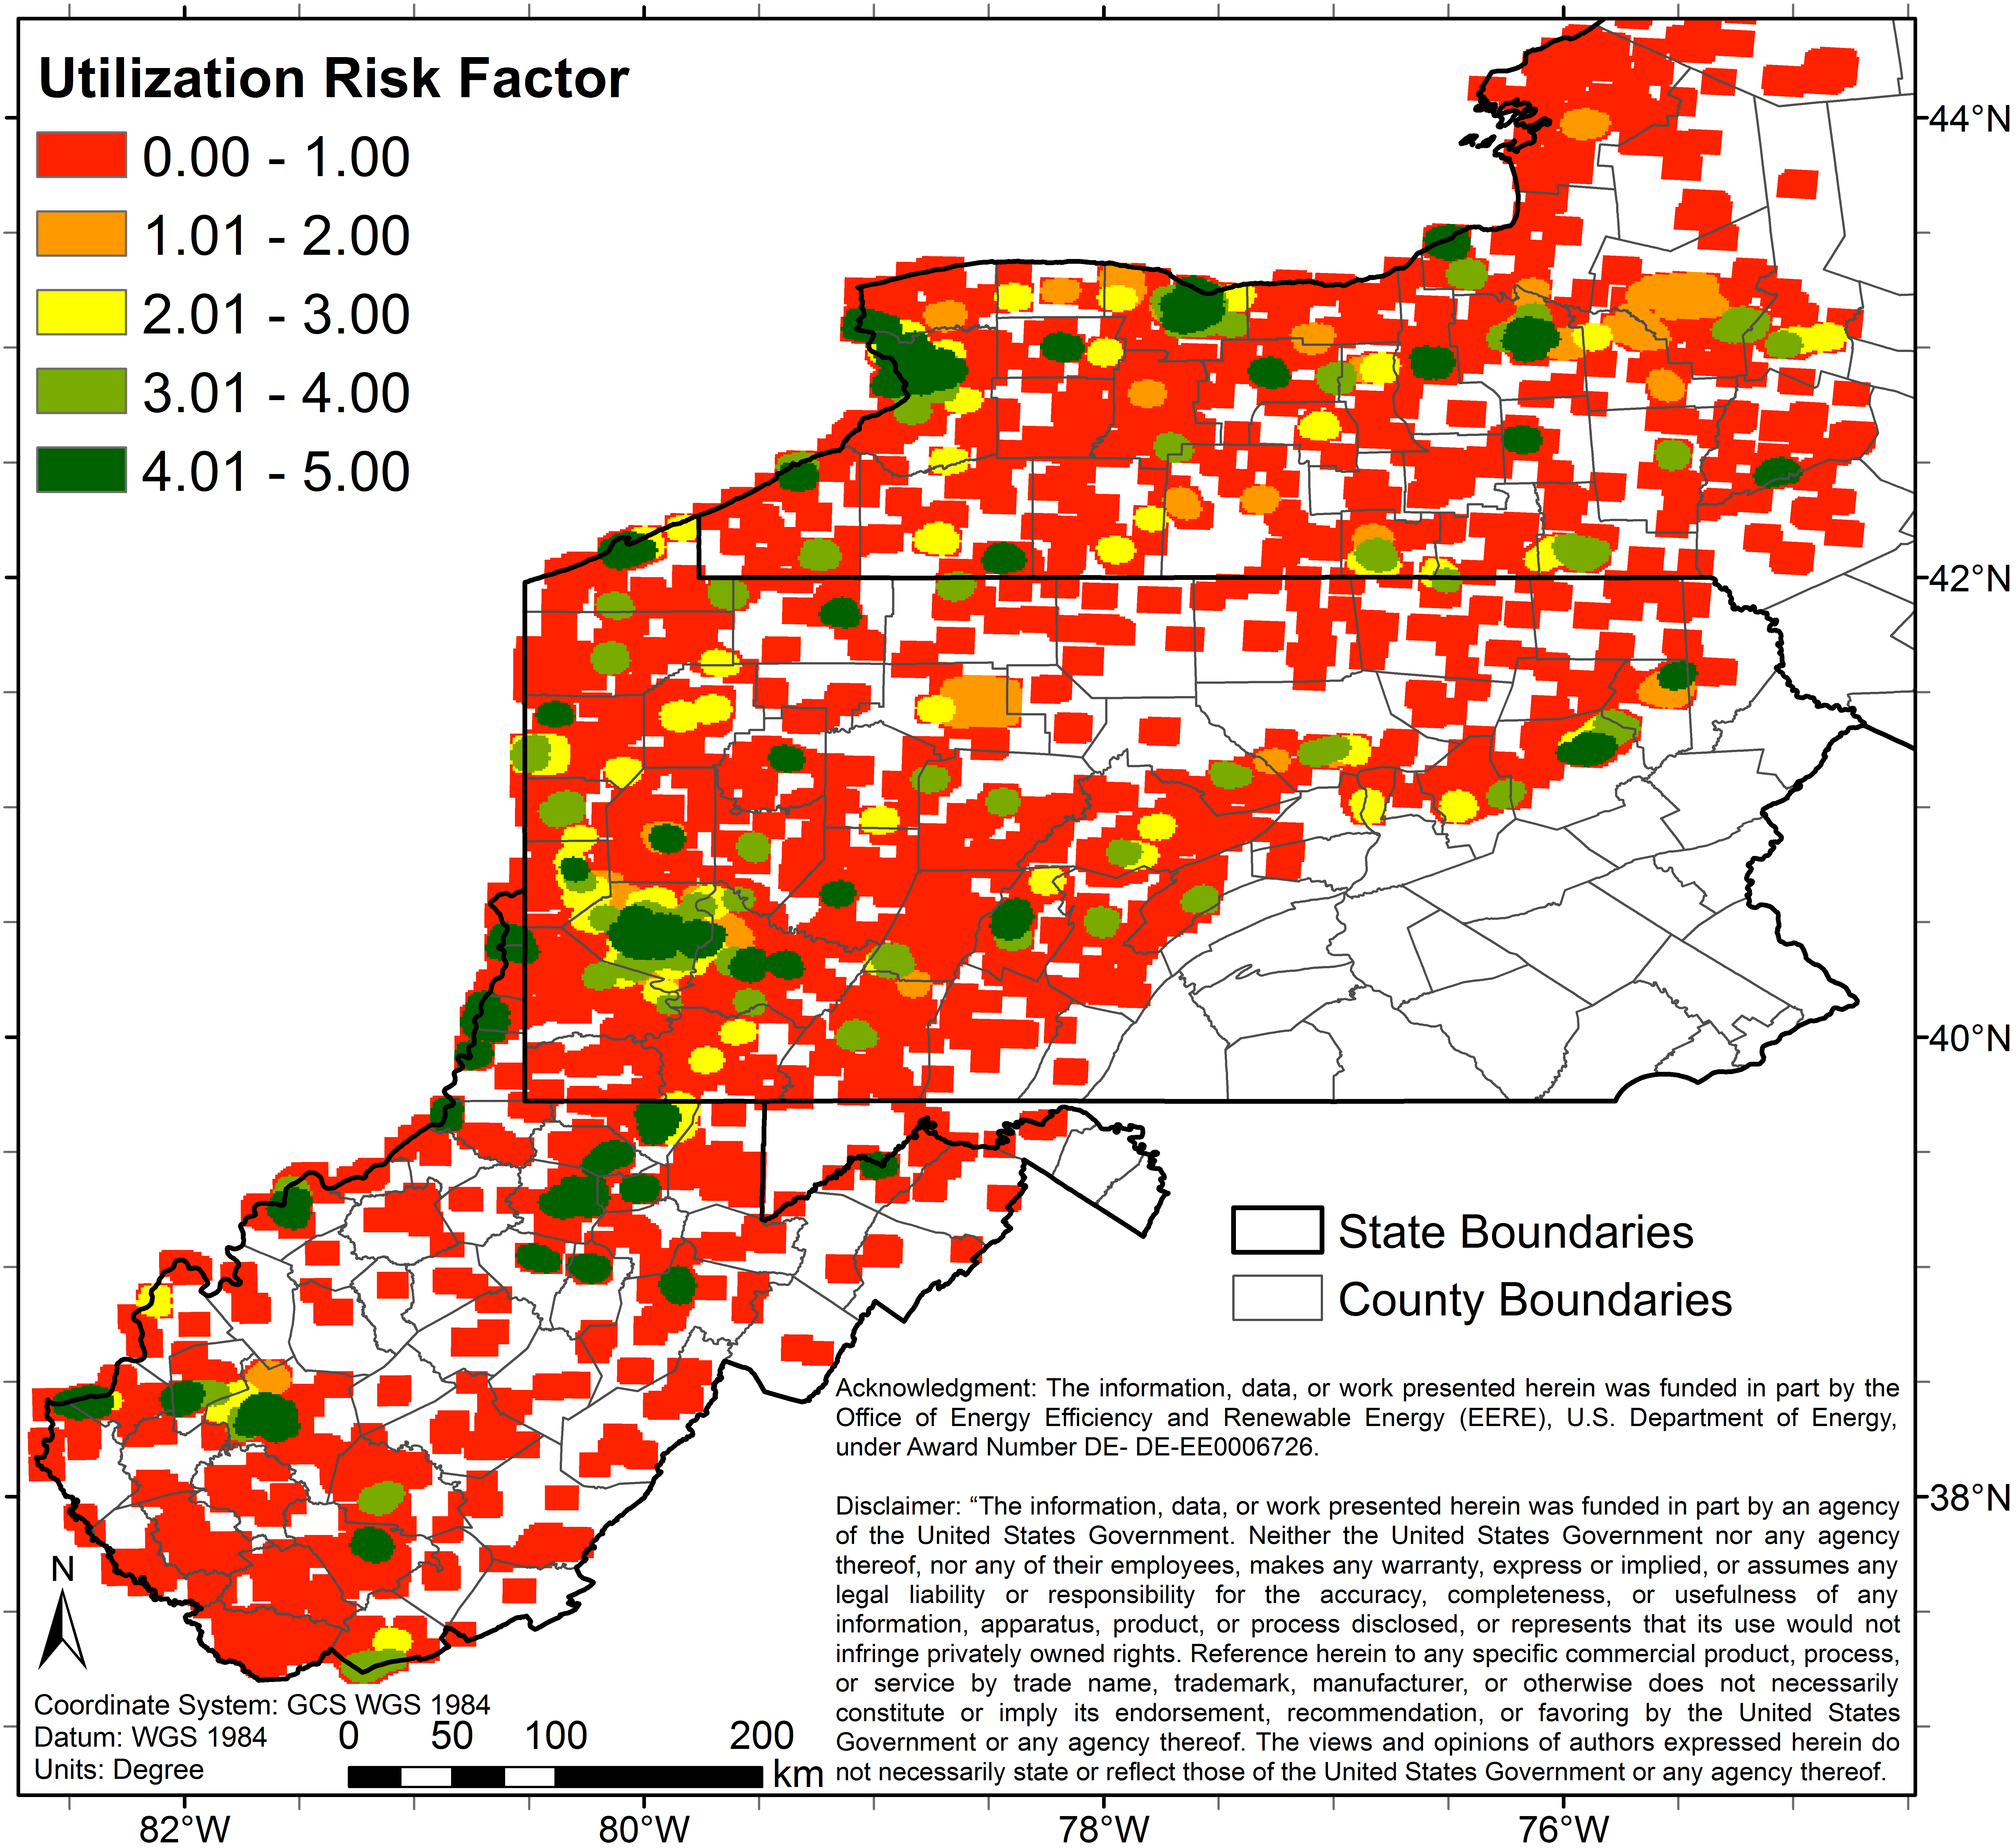
This submission contains information used to compute the risk factors for the GPFA-AB project. The risk factors are natural reservoir quality, thermal resource quality, potential for induced seismicity, and utilization. The methods used to combine the risk factors included taking the product, sum, and minimum of the four risk factors.
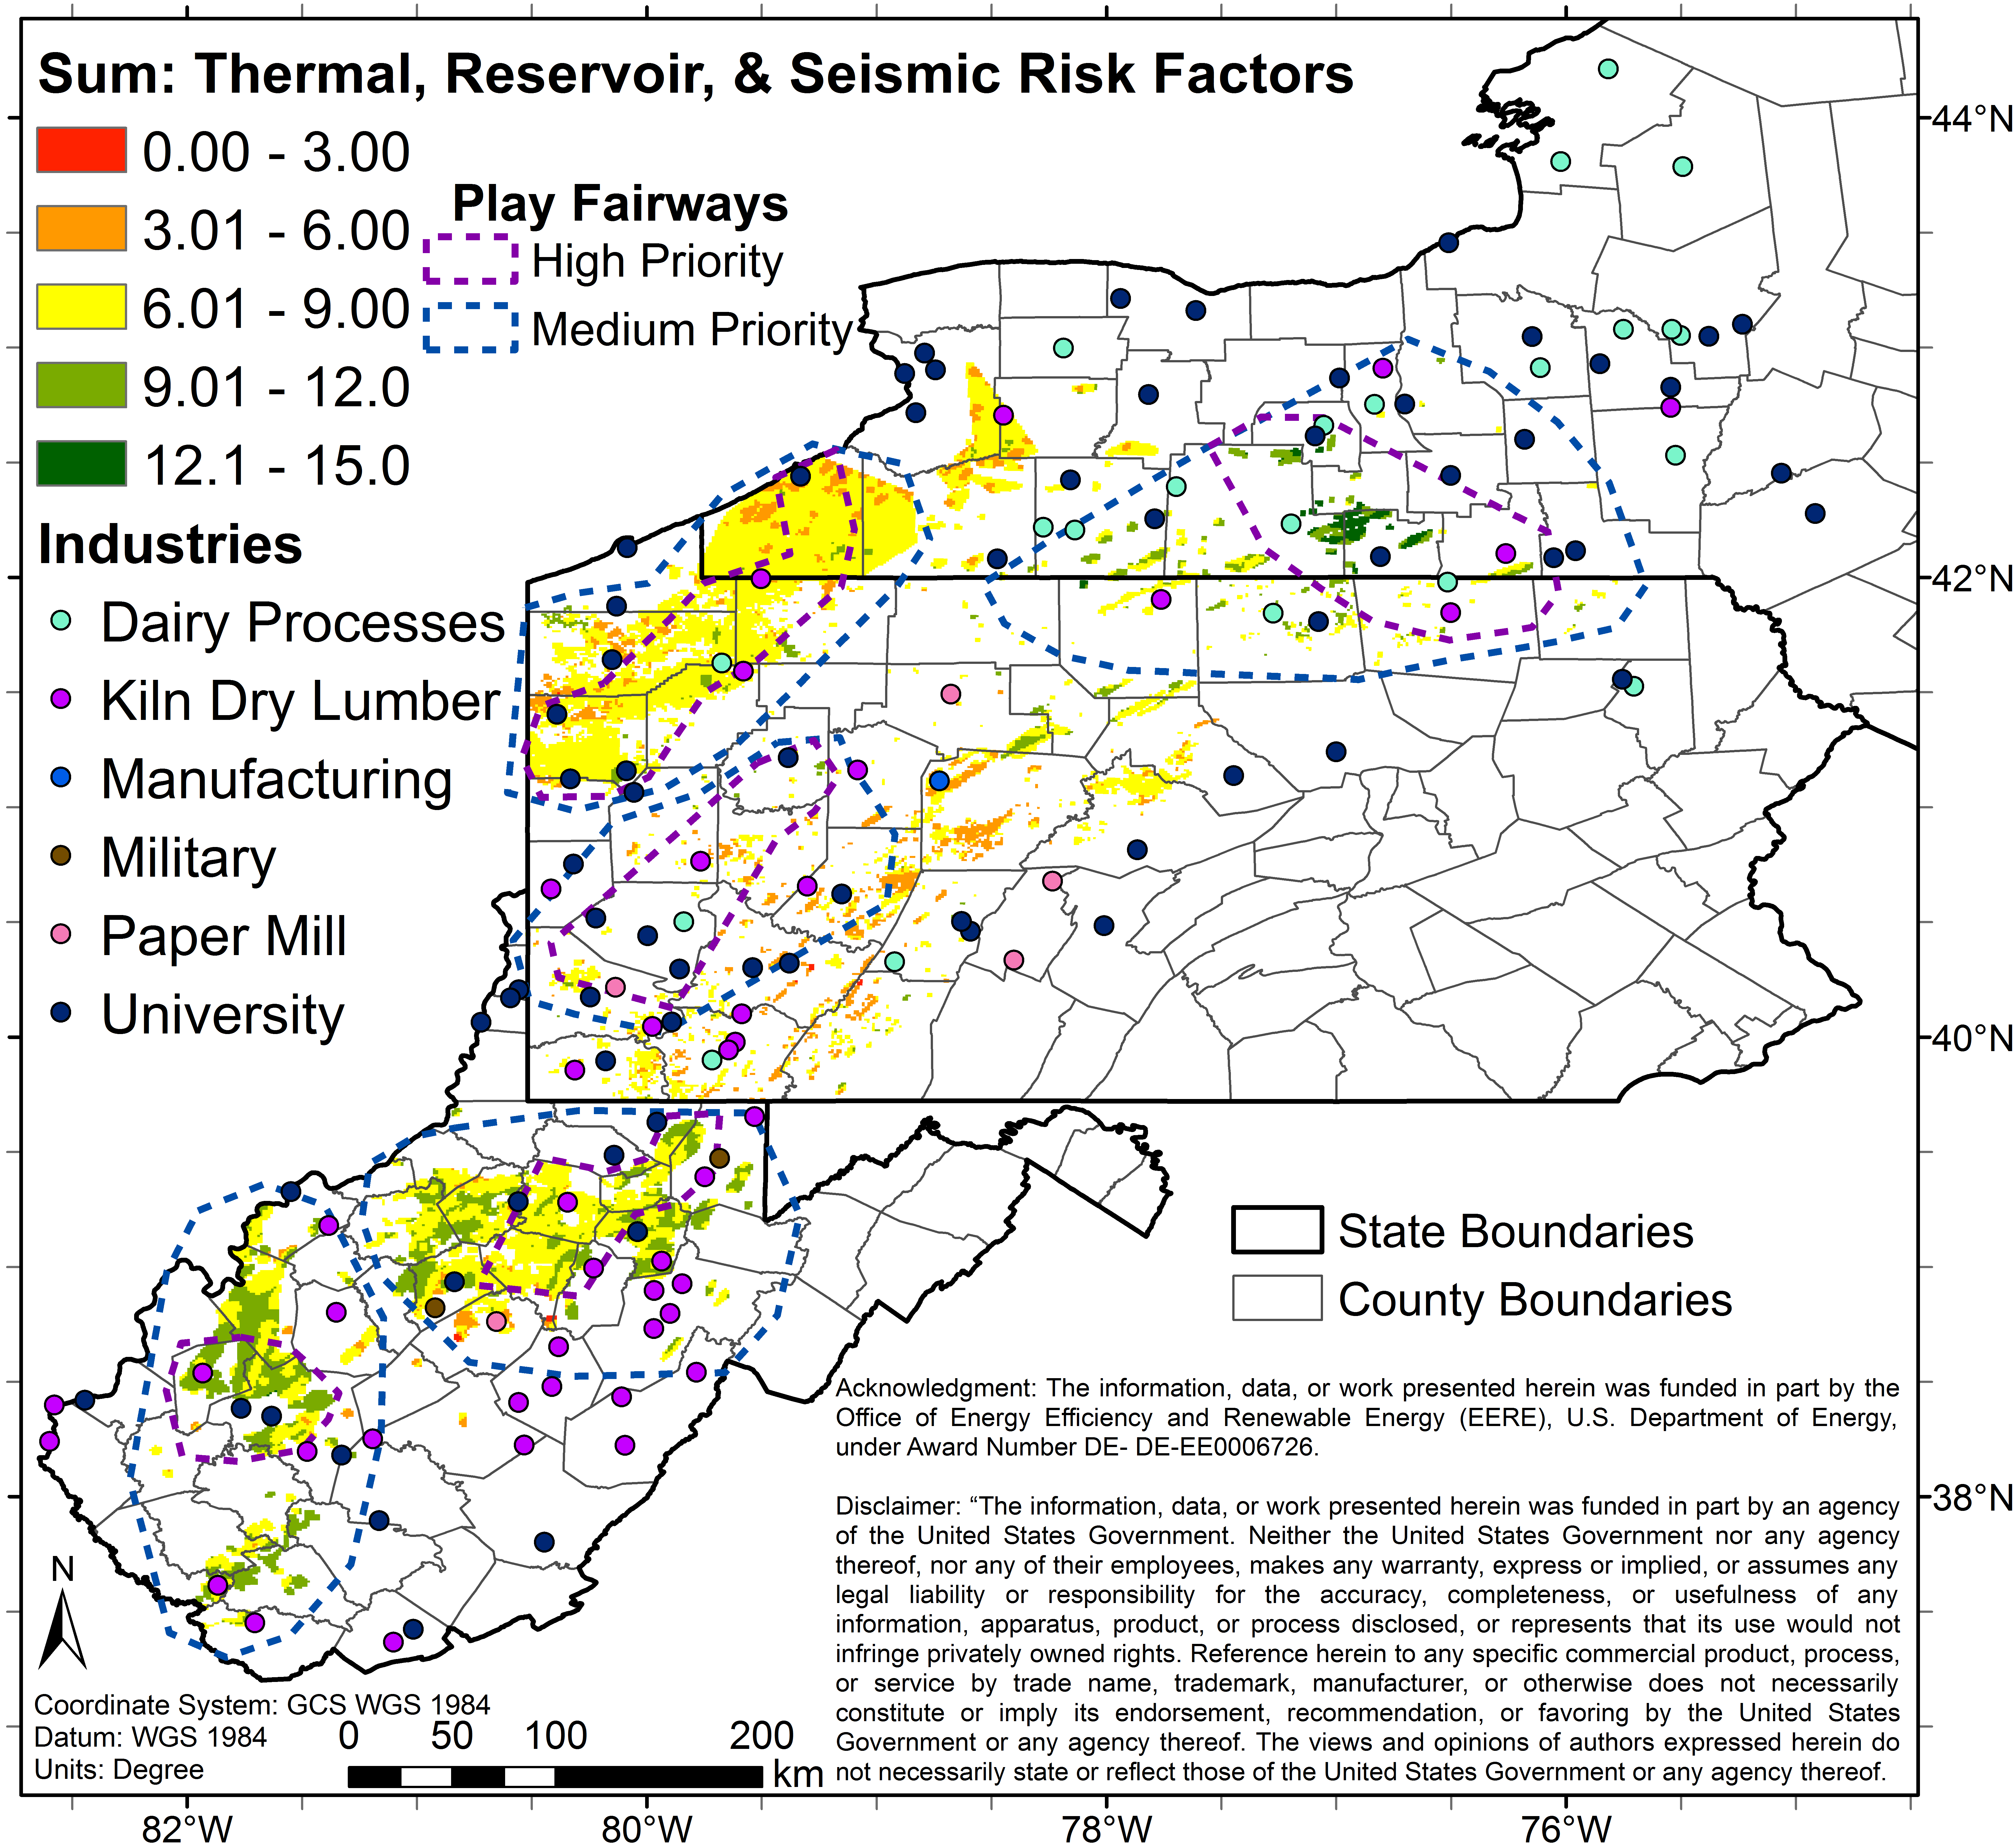
The files are divided into images, rasters, shapefiles, and supporting information. The image files show what the raster and shapefiles should look like. The raster files contain the input risk factors, calculation of the scaled risk factors, and calculation of the combined risk factors. The shapefiles include definition of the fairways, definition of the US Census Places, the center of the raster cells, and locations of industries. Supporting information contains details of the calculations or processing used in generating the files. An image of the raster will have the same name except *.png as the file ending instead of *.tif. Images with 'fairways' or 'industries' added to the name are composed of a raster with the relevant shapefile added.
The file About_GPFA-AB_Phase1RiskAnalysisTask5DataUpload.pdf contains information the citation, special use considerations, authorship, etc.
***See 'GPFA-AB.zip' at bottom for compressed and organized version of the files associated with this submission***
**More details (including location) on each file are given in the spreadsheet 'list_of_contents.csv' in the folder 'SupportingInfo'**
Code used to calculate values is available:
https://github.com/calvinwhealton/geothermal_pfa under the folder 'combining_metrics' - *See link below*
About Data Upload.pdf
Code for Calculations
Fishnet2_label.cpg
Fishnet2_label.dbf
Fishnet2_label.prj
Fishnet2_label.shp
Fishnet2_label.shp.xml
Fishnet2_label.shx
FixedQ2.cpg
FixedQ2.dbf
FixedQ2.prj
FixedQ2.sbn
FixedQ2.sbx
FixedQ2.shp
FixedQ2.shx
GPFA-AB.zip
GPFA-AB_combining_risk_factors.pdf
HighPriority.lyr
Industries_FINAL.cpg
Industries_FINAL.dbf
Industries_FINAL.lyr
Industries_FINAL.prj
Industries_FINAL.sbn
Industries_FINAL.sbx
Industries_FINAL.shp
Industries_FINAL.shx
List of Contents.csv
MediumPriority.lyr
co_3_0_12_s.png
co_3_0_12_s.tif
co_3_0_12_s_fairways.png
co_3_0_27_p_egs.png
co_3_0_27_p_egs.tif
co_3_0_27_p_geo.png
co_3_0_27_p_geo_fairways.png
co_3_0_27_p_geo_fairways.tif
co_3_0_27_p_geo_industries.png
co_3_0_27_p_geo_industries_fairways.png
co_3_0_3_m.png
co_3_0_3_m.tif
co_3_0_3_m_egs.png
co_3_0_3_m_egs.tif
co_3_0_3_m_fairways.png
co_3_0_3_m_geo.png
co_3_0_3_m_geo.tif
co_3_0_3_m_geo_fairways.png
co_3_0_3_m_geo_industries.png
co_3_0_3_m_geo_industries_fairways.png
co_3_0_81_p.png
co_3_0_81_p.tif
co_3_0_81_p_fairways.png
co_3_0_9_s_egs.png
co_3_0_9_s_egs.tif
co_3_0_9_s_geo.png
co_3_0_9_s_geo.tif
co_3_0_9_s_geo_fairways.png
co_3_0_9_s_geo_industries.png
co_3_0_9_s_geo_industries_fairways.png
co_5_0_125_p_egs.png
co_5_0_125_p_egs.tif
co_5_0_125_p_geo.png
co_5_0_125_p_geo.tif
co_5_0_125_p_geo_fairways.png
co_5_0_125_p_geo_industries.png
co_5_0_125_p_geo_industries_fairways.png
co_5_0_15_s_egs.png
co_5_0_15_s_egs.tif
co_5_0_15_s_geo.png
co_5_0_15_s_geo.tif
co_5_0_15_s_geo_fairways.png
co_5_0_15_s_geo_industries.png
co_5_0_15_s_geo_industries_fairways.png
co_5_0_20_s.png
co_5_0_20_s.tif
co_5_0_20_s_fairways.png
co_5_0_5_m.png
co_5_0_5_m.tif
co_5_0_5_m_egs.png
co_5_0_5_m_egs.tif
co_5_0_5_m_fairways.png
co_5_0_5_m_geo.png
co_5_0_5_m_geo.tif
co_5_0_5_m_geo_fairways.png
co_5_0_5_m_geo_industries.png
co_5_0_5_m_geo_industries_fairways.png
co_5_0_625_p.png
co_5_0_625_p.png
co_5_0_625_p.tif
co_pfa_sd3_p_geo.png
co_pfa_sd3_p_geo.tif
co_pfa_sd3_s_geo.png
co_pfa_sd3_s_geo.tif
co_pfa_sd5_p_geo.png
co_pfa_sd5_p_geo.tif
co_pfa_sd5_s_geo.png
co_pfa_sd5_s_geo.tif
co_pfa_var3_p_geo.png
co_pfa_var3_p_geo.tif
co_pfa_var3_s_geo.png
co_pfa_var3_s_geo.tif
co_pfa_var5_p_geo.png
co_pfa_var5_p_geo.tif
co_pfa_var5_s_geo.png
co_pfa_var5_s_geo.tif
fairwaysOuter.cpg
fairwaysOuter.dbf
fairwaysOuter.prj
fairwaysOuter.qpj
fairwaysOuter.shp
fairwaysOuter.shx
placesofinterest2.cpg
placesofinterest2.dbf
placesofinterest2.prj
placesofinterest2.qpj
placesofinterest2.shp
placesofinterest2.shx
re_3_0_3_NA.png
re_3_0_3_NA.tif
re_5_0_5_NA.png
re_5_0_5_NA.tif
re_pfa_sd3.png
re_pfa_sd3.tif
re_pfa_sd5.png
re_pfa_sd5.tif
re_pfa_var3.png
re_pfa_var3.tif
re_pfa_var5.png
re_pfa_var5.tif
seEq_3_0_3_NA.tif
seEq_5_0_5_NA.tif
seEq_pfa_sd3.tif
seEq_pfa_sd5.tif
seEq_pfa_var3.tif
seEq_pfa_var5.tif
seSt_3_0_3_NA.tif
seSt_5_0_5_NA.tif
seSt_pfa_sd3.tif
seSt_pfa_sd5.tif
seSt_pfa_var3.tif
seSt_pfa_var5.tif
se_3_0_3_a.png
se_3_0_3_a.tif
se_5_0_5_a.png
se_5_0_5_a.tif
se_pfa_sd3.png
se_pfa_sd3.tif
se_pfa_sd5.png
se_pfa_sd5.tif
se_pfa_var3.png
se_pfa_var3.tif
se_pfa_var5.png
se_pfa_var5.tif
seeq_3_0_3.png
seeq_5_0_5.png
seeq_sd3.png
seeq_sd5.png
seeq_var3.png
seeq_var5.png
sest_3_0_3.png
sest_5_0_5.png
sest_sd3.png
sest_sd5.png
sest_var3.png
sest_var5.png
th_3_0_3_NA.png
th_3_0_3_NA.tif
th_5_0_5_NA.png
th_5_0_5_NA.tif
th_pfa_sd3.png
th_pfa_sd3.tif
th_pfa_sd5.png
th_pfa_sd5.tif
th_pfa_var3.png
th_pfa_var3.tif
th_pfa_var5.png
th_pfa_var5.tif
usCensusPlaces.cpg
usCensusPlaces.csv
usCensusPlaces.dbf
usCensusPlaces.prj
usCensusPlaces.qpj
usCensusPlaces.shp
usCensusPlaces.shx
ut0_3_0_3_NA.png
ut0_3_0_3_NA.tif
ut0_5_0_5_NA.png
ut0_5_0_5_NA.tif
ut5_3_0_3_NA.png
ut5_3_0_3_NA.tif
ut5_5_0_5_NA.png
ut5_5_0_5_NA.tif
Citation Formats
TY  - DATA
AB  - This submission contains information used to compute the risk factors for the GPFA-AB project. The risk factors are natural reservoir quality, thermal resource quality, potential for induced seismicity, and utilization. The methods used to combine the risk factors included taking the product, sum, and minimum of the four risk factors.
The files are divided into images, rasters, shapefiles, and supporting information. The image files show what the raster and shapefiles should look like. The raster files contain the input risk factors, calculation of the scaled risk factors, and calculation of the combined risk factors. The shapefiles include definition of the fairways, definition of the US Census Places, the center of the raster cells, and locations of industries. Supporting information contains details of the calculations or processing used in generating the files. An image of the raster will have the same name except *.png as the file ending instead of *.tif. Images with 'fairways' or 'industries' added to the name are composed of a raster with the relevant shapefile added.

The file About_GPFA-AB_Phase1RiskAnalysisTask5DataUpload.pdf contains information the citation, special use considerations, authorship, etc.

***See 'GPFA-AB.zip' at bottom for compressed and organized version of the files associated with this submission***

**More details (including location) on each file are given in the spreadsheet 'list_of_contents.csv' in the folder 'SupportingInfo'**

Code used to calculate values is available:
https://github.com/calvinwhealton/geothermal_pfa under the folder 'combining_metrics' - *See link below*

AU  - E., Teresa
DB  - Geothermal Data Repository
DP  - Open EI | National Laboratory of the Rockies
DO  - 10.15121/1261942
KW  - geothermal
KW  - Appalachian Basin
KW  - West Virginia
KW  - New York
KW  - Pennsylvania
KW  - district heating
KW  - low-temperature
KW  - deep direct use
KW  - combined risk segment map
KW  - risk analysis
KW  - geothermal play fairway analysis
KW  - GPFA-AB
KW  - PFA
KW  - raster
KW  - shapefile
KW  - shape file
KW  - ArcGIS
KW  - GIS
KW  - geospatial data
KW  - seismic
KW  - seismicity
KW  - risk
KW  - low temperature
KW  - risk factor
KW  - play fairway analysis
LA  - English
DA  - 2015/09/30
PY  - 2015
PB  - Cornell University
T1  - Risk Factor Analysis in Low-Temperature Geothermal Play Fairway Analysis for the Appalachian Basin (GPFA-AB)
UR  - https://doi.org/10.15121/1261942
ER  -
E., Teresa. Risk Factor Analysis in Low-Temperature Geothermal Play Fairway Analysis for the Appalachian Basin (GPFA-AB). Cornell University, 30 September, 2015, Geothermal Data Repository. https://doi.org/10.15121/1261942.
E., T. (2015). Risk Factor Analysis in Low-Temperature Geothermal Play Fairway Analysis for the Appalachian Basin (GPFA-AB). [Data set]. Geothermal Data Repository. Cornell University. https://doi.org/10.15121/1261942
E., Teresa. Risk Factor Analysis in Low-Temperature Geothermal Play Fairway Analysis for the Appalachian Basin (GPFA-AB). Cornell University, September, 30, 2015. Distributed by Geothermal Data Repository. https://doi.org/10.15121/1261942
@misc{GDR_Dataset_622,
title = {Risk Factor Analysis in Low-Temperature Geothermal Play Fairway Analysis for the Appalachian Basin (GPFA-AB)},
author = {E., Teresa},
abstractNote = {This submission contains information used to compute the risk factors for the GPFA-AB project. The risk factors are natural reservoir quality, thermal resource quality, potential for induced seismicity, and utilization. The methods used to combine the risk factors included taking the product, sum, and minimum of the four risk factors.

The files are divided into images, rasters, shapefiles, and supporting information. The image files show what the raster and shapefiles should look like. The raster files contain the input risk factors, calculation of the scaled risk factors, and calculation of the combined risk factors. The shapefiles include definition of the fairways, definition of the US Census Places, the center of the raster cells, and locations of industries. Supporting information contains details of the calculations or processing used in generating the files. An image of the raster will have the same name except *.png as the file ending instead of *.tif. Images with 'fairways' or 'industries' added to the name are composed of a raster with the relevant shapefile added.


The file About_GPFA-AB_Phase1RiskAnalysisTask5DataUpload.pdf contains information the citation, special use considerations, authorship, etc.


***See 'GPFA-AB.zip' at bottom for compressed and organized version of the files associated with this submission***


**More details (including location) on each file are given in the spreadsheet 'list_of_contents.csv' in the folder 'SupportingInfo'**


Code used to calculate values is available:

https://github.com/calvinwhealton/geothermal_pfa under the folder 'combining_metrics' - *See link below*

},
url = {https://gdr.openei.org/submissions/622},
year = {2015},
howpublished = {Geothermal Data Repository, Cornell University, https://doi.org/10.15121/1261942},
note = {Accessed: 2026-01-27},
doi = {10.15121/1261942}
}
https://dx.doi.org/10.15121/1261942
Details
Data from Sep 30, 2015
Last updated Jan 10, 2020
Submitted Oct 29, 2015
Organization
Cornell University
Contact
Teresa E. Jordan
607.255.3596
Authors
Teresa E.
Cornell UniversityKeywords
geothermal, Appalachian Basin, West Virginia, New York, Pennsylvania, district heating, low-temperature, deep direct use, combined risk segment map, risk analysis, geothermal play fairway analysis, GPFA-AB, PFA, raster, shapefile, shape file, ArcGIS, GIS, geospatial data, seismic, seismicity, risk, low temperature, risk factor, play fairway analysisDOE Project Details
Project Name Low Temperature Geothermal Play Fairway Analysis for the Appalachian Basin
Project Lead Holly Thomas
Project Number EE0006726